


1. Introduction
Acoustically, a speaker’s articulatory movements, or the filter of speech, are measured by the formant frequency (Fant, 1973). Specifically, the first formant value varies according to the degree of jaw opening while the second formant value does according to the tongue position. In general, the formant values of men tend to be lower than those of women, mainly due to anatomical differences. The formant value is inversely related to the vocal tract length (Pickett, 1980): the vocal tracts of men are shorter than those of women. Yang (1996) estimated the ratio of the vocal tract lengths of men to those of women from the third formant of the English vowel /Λ/ reported in Peterson & Barney (1952) as 1 to 0.86, which indicates that the vocal tracts of women are 14% shorter than those of men.
Linguists and phoneticians pursue the linguistic aspects of vowel quality after removing nonlinguistic physiological differences from the acoustic data. An examination on formant variations could enhance the understanding of the phonetic and phonological aspects of language. Previous studies have reported several formant measurements of males, females, and children (Hillenbrand et al., 1995; Peterson & Barney, 1952; Yang, 1990, 1996). Peterson & Barney (1952) listed the formant values of ten English vowels produced by 76 speakers and showed vast but systematic differences among the vowel formant values. Hillenbrand et al. (1995) extensively studied vowel formants produced by 139 American participants at a sustained vowel segment. Yang (1990) observed a strong positive correlation between male and female formant values in Dutch, English, and Korean and proposed a normalization method using linear regression equations. Yang (1990, 1996) compared the vowel spaces of English and Korean languages by using regression coefficients to scale the formant values of the vowels in the context of /hνd/ produced by 40 American and Korean males and females. From the comparison, it was observed that either sufficient perceptual contrast or similar perceptual distance was maintained between adjacent vowels. The vowel shapes of the two languages appear as either rectangular or triangular as a result of securing perceptual contrast. Additionally, the same factor exerts an influence on lax vowels /I, ℧/ in English to approach to the center of the vowel space. It is noted in the study that the cross-linguistic difference would have been much greater without normalization. Regression analysis could summarize the relationship between the two sex groups via intercepts, slopes, and r-squared values, indicating the power of a predictive model. A better model can have a higher r-squared value and a smaller residual standard error (RSE). The idea behind this normalization approach is that any systematic acoustic difference between the two sex groups can be primarily attributed to anatomical differences, which are irrelevant to the linguistic aspects of vowels (see Flynn, 2011; Watt & Fabricius, 2002; Yang, 1990 for additional detail).
Formant measurements are prone to errors, and several attempts to obtain valid and reliable values were made (Hillenbrand et al., 1995; Peterson & Barney, 1952; Yang, 1990, 1996). The first step can be to elicit enunciation of the correct target vowels and then to recruit participants of a homogeneous dialect. Then, correct settings of the analysis software and visual checks of the measurements on a spectrogram are necessary. Yang (1990, 1996) monitored participants while recording, as Peterson & Barney (1952) did, and screened participants with a different dialect based on background information and peer listener judgments of randomly chosen speech samples. Hillenbrand et al. (1995) monitored and administered a listening task of the /a/-/ɔ/ pair and additional minimal pairs to select the participants of a dialect. To ensure that vowel segmentation and the number setting of formants in the speech analysis software were appropriate, Renwick & Ladd (2016) used the automatic aligner SPPAS (Bigi & Hirst, 2018) and visually checked the onset and the offset of F2 and the major points of spectral change at each syllable boundary before and after the target vowel. They proposed five formants with a ceiling of 4,500 Hz for the measurements of the vowels produced by male speakers and four formants with a ceiling of 5,000 Hz for female speakers as a guideline. A wideband spectrogram with a visible dark band can be a good guide for determining formant values.
Several statistical tests have been performed using formant data or other data collected at one point of a vowel segment (Fowler & Housum, 1987; Wright, 2003). For example, Fowler & Housum (1987) compared the words in a spontaneous and natural monologue and reported that speakers produce old words or the second occurrences by shortening them. They calculated the Euclidean distance between a vowel and the center of the vowel space of two different modes. Wright (2003) reported that easy words are more centralized in the vowel space than hard words with the same vowel distances. However, as described in the introduction of Yang (2018), any comparison of one measurement point easily misses the nonlinear characteristics of vowel production. Some formant values change throughout a given vowel segment and even overlap within and across sex and age groups (Yang, 2009, 2010). Presently, not many studies have compared formant values obtained at several measurement points over time by sex groups. Hence, this study attempts to compare curvilinearly varying formant measurements along vowel segments. Generalized additive mixed models (GAMMs) are used to test for statistical significance between the groups of men and women for that purpose (Sóskuthy, 2017; van Rij, 2015; Wood, 2006).
The main purpose of this study was to establish curvilinear formant data for American speakers and to apply GAMMs to compare the normalized values. Specifically, the current study was designed to investigate 1) formant trajectories of American men and women, 2) scaling of the formant values of the two groups, and 3) a nonlinear trajectory comparison between the normalized formant values.
2. Method
According to Hillenbrand et al. (1995), a total of 93 American men and women (45 men and 48 women) participated in their recordings. All participants were screened to form a dialectally homogeneous group of people. Their major criteria were whether the participants could distinguish the /a/-/ɔ/ pair and additional minimal pairs.
To recap the stimuli set and the recording procedure briefly, all participants read a randomized list of 12 /hνd/ words. Here only nine vowels (/i, I, ε, æ, a, ɔ, ℧, u, Λ/) were analyzed excluding the two diphthongs (/eI, o℧/) and a right-hook reversed epsilon (/ɝ/). The excluded vowels had various individual formant trajectories, which may need a separate scaling and analysis. Their voices were stored on a digital audio recorder through a dynamic microphone. A total of 837 sound files were recorded. The researchers monitored the recording process and a group of graduate students conducted identification tests on the recorded words and listed 20 misidentified vowels online. We also excluded these vowels from the current study, as misidentified vowels of different targets might bias the means and standard deviations, which are used to scale the data (biased scale factors may be inappropriate for valid and reliable speaker normalization).
The soundfiles and time_data.txt were downloaded from http://homepages.wmich.edu/~hillenbr/voweldata.html. Praat (v.6.0.43, Boersma & Weenink, 2019) was used to collect formant values. The downloaded sound files were read to Praat Objects using a folder-file reading script. The time_data.txt file was edited to include only the file names, and the starts and ends of the 817 vowel segments. The file name consisted of the participant’s group initial (i.e., m for men, w for women), a two-digit ID, and the vowel. The name was divided into its component columns, and the front/back column was added to divide the sound files into four groups: Front vowels and back vowels of men and of women. Then, a formant measurement script was created to collect formant values at the proportionate six time points within each vowel segment. Since the formant number setting is important to valid formant measurements of rounded vowels, the number was initially set and tweaked later as follows: 4.0 with a ceiling of 5,000 Hz for the front vowels of women; 4.5 for the back vowels of women; 4.5 for the front vowels of men; 5.0 for the back vowels of men. The formant script took the parameters from the time data and calculated the total duration of each vowel segment. Six time points were calculated from the total duration. A window size of 45 ms was arbitrarily chosen to avoid undefined formant values with shorter windows. The name of the sound file, loop number, formant values, and time points were appended to a text file on a computer. The formant difference of adjacent measurement points was calculated and added to the text file for subsequent inspection of jumps and drops in adjacent values. Out of 10,044 collected values (837 vowels×6 time points×2 formants), 20 misidentified vowel data were removed to establish the final set of 9,804 values.
Then, the author checked the validity of the formant values in Praat. Spurious values were detected and corrected by reading the five adjacent value differences. Some of these values were corrected by checking the original sound file and expanding the waveform around the time point to trace the given formant trajectories on a wideband spectrogram. Vowel normalization and statistical analyses were conducted using R (R Core Team, 2019).
3. Results and Discussion
The formant values of the men and women sampled at time point 2 are plotted in Figure 1. As expected, the vowel space of the men appears smaller than that of the women, and there seems to be a systematic shift between them. In the figure, we can easily notice that the formant data of the women expand systematically from those of the men. The main cause of the expansion can be attributed to the shorter vocal tract length of the woman, which results in nonlinguistic differences of their production gestures. A shorter tube yields higher formant values because the acoustic values are inversely related to length (Pickett, 1980).
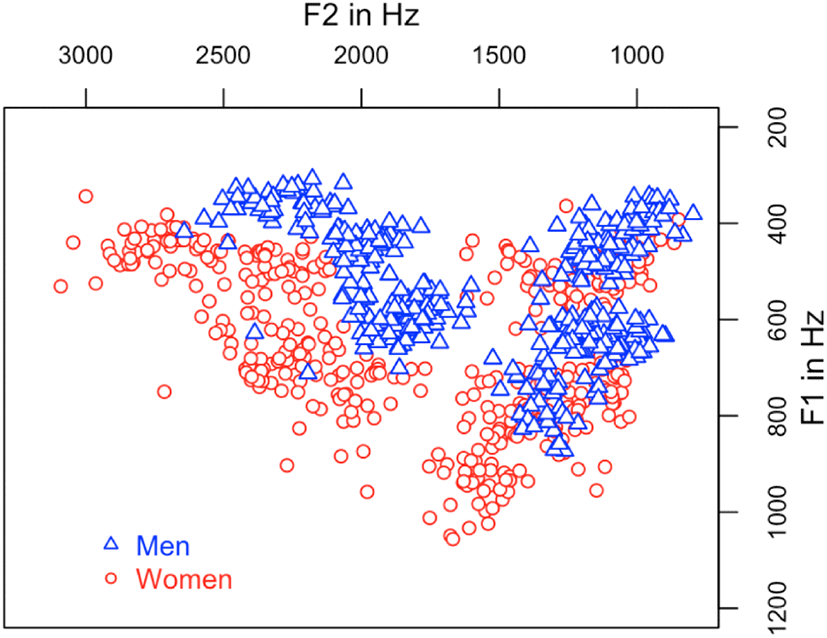
If we statistically compare the two vowel spaces without considering the anatomical difference, the results are expected to be significantly different. However, people perceive the same vowel despite this acoustical difference. Here, speaker normalization is needed; let us consider the variations of the raw formant data before we find an appropriate method of normalization.
The standard deviation (s.d.) is a useful measure of the variation of the raw formant data. Figure 2 illustrates the deviations according to sex and formant.
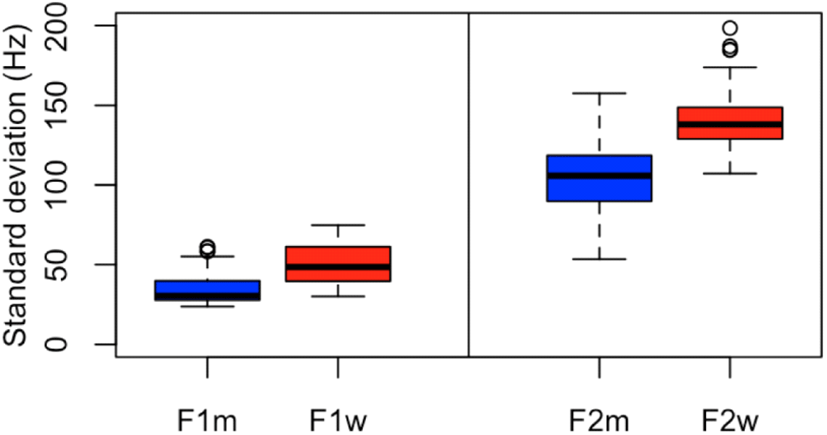
The deviations of the vowels produced by the women are higher than those produced by the men. Thick lines indicate the medians of each group. The median s.d. values of F1 are 30.5 Hz and 48.5 Hz for men and women, respectively, while those of F2 are 105.8 Hz and 138.0 Hz for each group, respectively. There are some outliers (in circles) 1.5 times above the upper quartile of F1 for the men and F2 for the women. The boxes include 50% of the data in the corresponding groups, and the sizes of the boxes differ. Thus, any scaling of the data may need separate factors for F1 and F2. If we apply a uniform scaling factor based on one of the two formants, we would end up over- or under-scaling the other formants. In addition, the first formant values are related to the degree of jaw opening while the second formant values are related to the tongue position in the vocal tract (Nordstroem & Lindblom, 1975). Jaw opening and tongue position are independent but interact within a rather fixed vocal tract space, which might be related to the non-uniform configuration of the vocal tracts of men when compared with those of women. Yang (1990) estimated the lengths of the back and front cavities from American and Korean vowel /i/ and reported that the average back cavity was approximately 5.6 cm for both American and Korean men, 5.0 cm for American women, and 4.9 cm for Korean women. In addition, the average front cavities were 7.3 cm and 7.7 cm for American and Korean men, respectively, and 6.0 cm for both American and Korean women.
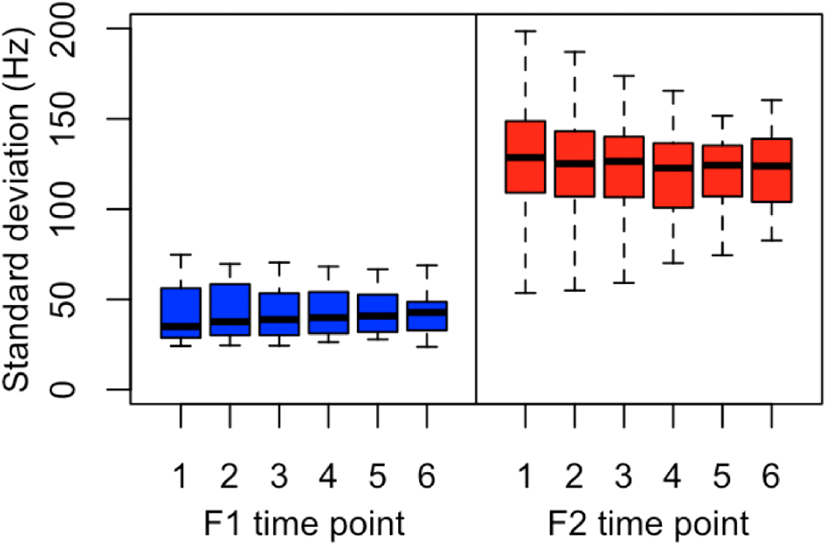
Figure 3 shows the variation of F1 and F2 at six time points. The median s.d. values of F1 range from 35 Hz to 40.8 Hz while those of F2 range from 122.7 Hz to 128.5 Hz. The deviations of F1 are relatively stable when compared to those of F2. Here, the whiskers of F1 are similar but the box sizes are larger at the beginning of the vowel segments and smaller toward the end. The whiskers of F2 extend further at the beginning than at the end. Since they are the collapsed data of the man and woman groups, the deviation might become larger for each participant group. We observe that the gestures of vowel production vary by time point.
The formant values of the men and women in the previous section are quite different, but a systematic expansion or reduction from either the man’s vowel space or the woman’s vowel space was observable, and each formant shows different patterns in the deviations. Analysis of variance is a typical statistical analysis that can be used to analyze formant data measured over a sustained vowel portion by sex and vowel groups. However, we notice that the formant values vary across vowel segments, making a trajectory that depends on the articulatory gestures of the speaker’s jaw and tongue. Hence, any comparison of vowel formants at one measurement point may miss the important dynamic changes that can be seen in a nonlinear contour of formant values.
The scale function of R, which is a kind of z-transformation of the raw data (see R manual for details), was applied to scale the formant data of each group. Basically the raw formant data are standardized by finding the mean and the standard deviation, as described in Lobanov’s method (1971). To avoid negative values of the z-score, 4 was added to the scaled value. The first and second formant values were separately scaled because each formant reflects the jaw opening and tongue position of the speaker. Further exploration of scale methods using a uniform factor or each individual scaling factor would be interesting with new data sets.
The normalized formant values of the man and woman groups were compared using GAMMs (Sóskuthy, 2017; van Rij, 2015; Wood, 2006). Since we have nine vowels, we will show the statistical analysis of the vowel /æ/ in detail and then report the output figures of the other eight vowels in a single figure to save space.
When the time points of the vowel /æ/ were compared statistically, the following summary in Table 1 was obtained (the k was set to 5 considering the unique six measurement points minus one along with the rounded-off values and simplified major terms):
The parametric coefficients in the summary above were obtained from a regression analysis of all scaled first formant values measured at the six time points without considering formant trajectories. The intercept is statistically significant for the two groups but the slope is not. Even after normalization, there are group differences. The smooth terms in the lower half indicate that there are approximately 4 knots (see edf value 3.13 above) that should be considered significant points in the trajectories. Since the edf value is higher than 1, we can claim that curvilinear inspection of the data would be more appropriate. The deviance explained is 33.4%, which is moderate considering the number of participants. The moderate power may be related to the six measurement points at which the participants produced the vowel /æ/ with different gestures of jaw and tongue movements.
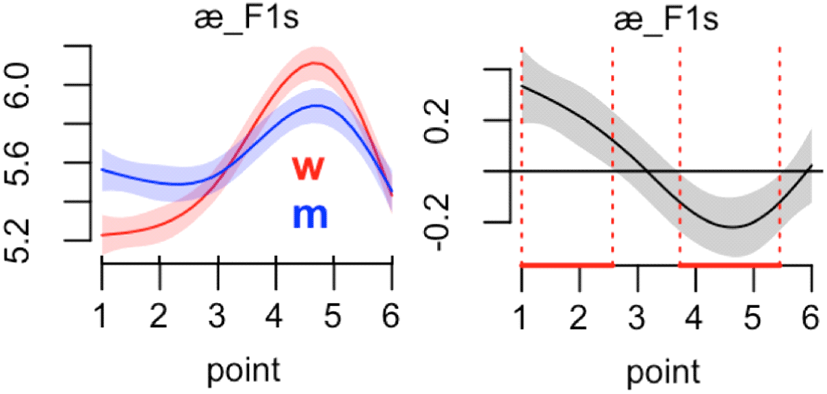
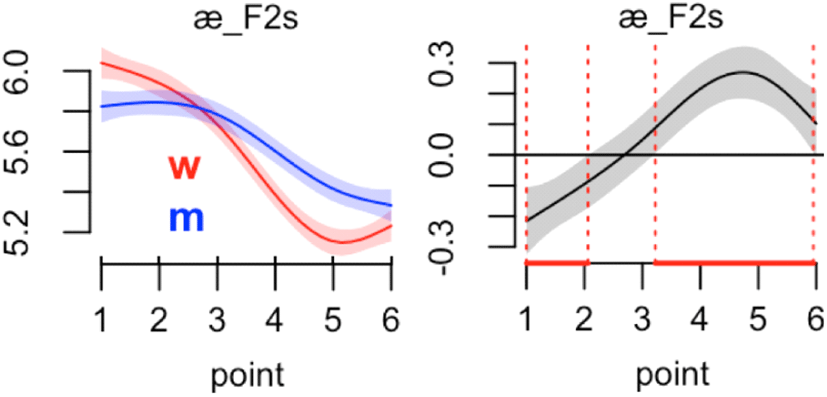
Figure 4 illustrates smooth and difference plots for those two groups. Generally, the scaled formant values of the men start low and increase in the later segment. A similar pattern is observed for the women, but there is more vertical variation. The woman’s trajectory has a higher hump than that of the men. The scaled formant values near time points 3 and 6 are converging. The right graph in Figure 4 shows where the two groups are significantly different in the production of the vowel /æ/ (i.e., at points 1 to 2 and 4 to 5); see Sóskuthy (2017:19) for the interpretation. Generally corresponding pointwise confidence intervals of men’s and women’s scaled vowel formant values in the smooth plot are used to calculate the p-value. Data points away from the zero base line on the y-axis in the right difference plot are considered to be significantly different. The red line on the x-axis between the vertical dotted lines visualizes the significant points along the trajectory. If we consider the fact that the first formant reflects the degree of jaw opening of the speaker, we could say that the opening gestures of men and women are different. In the figure, the women exerted more dynamic gestures than the men did. Whether a wavier shape leads to clearer perception might be pursued in future studies.
Additionally, we conducted GAMMs analysis on the scaled second formant of the vowel /æ/ with the following summary in Table 2:
There is a significant difference for the scaled second formant trajectory. The relation is not linear with more than three-knot curviness (see edf value 3.07 above). The edf indicates that GAMMs would be a better choice of statistical comparison. Figure 5 illustrates the smooth and difference plots of the scaled second formant values of the vowel /æ/. Again, the women’s scaled second formant values move more dynamically than those of the men. The difference smooth plot between the two groups in Figure 5 shows that these groups are significantly different at points 1 to 6 but not at point 3. In the previous section, we linearly scaled the formant values of the women to normalize them. It is interesting that the scaled formant values of the two sex groups near point 3 converge as they do in F1s. If we apply an individual scale factor for the vowel /æ/, then we may obtain the same converging point, but a different smooth line with fewer significant points.
Now we plotted the statistical comparisons for the remaining vowels together. Additionally, we discuss the interpretation and suggest possible future research. Figure 6 gives the smooth and difference plots of the two scaled formant values of the other eight vowels.
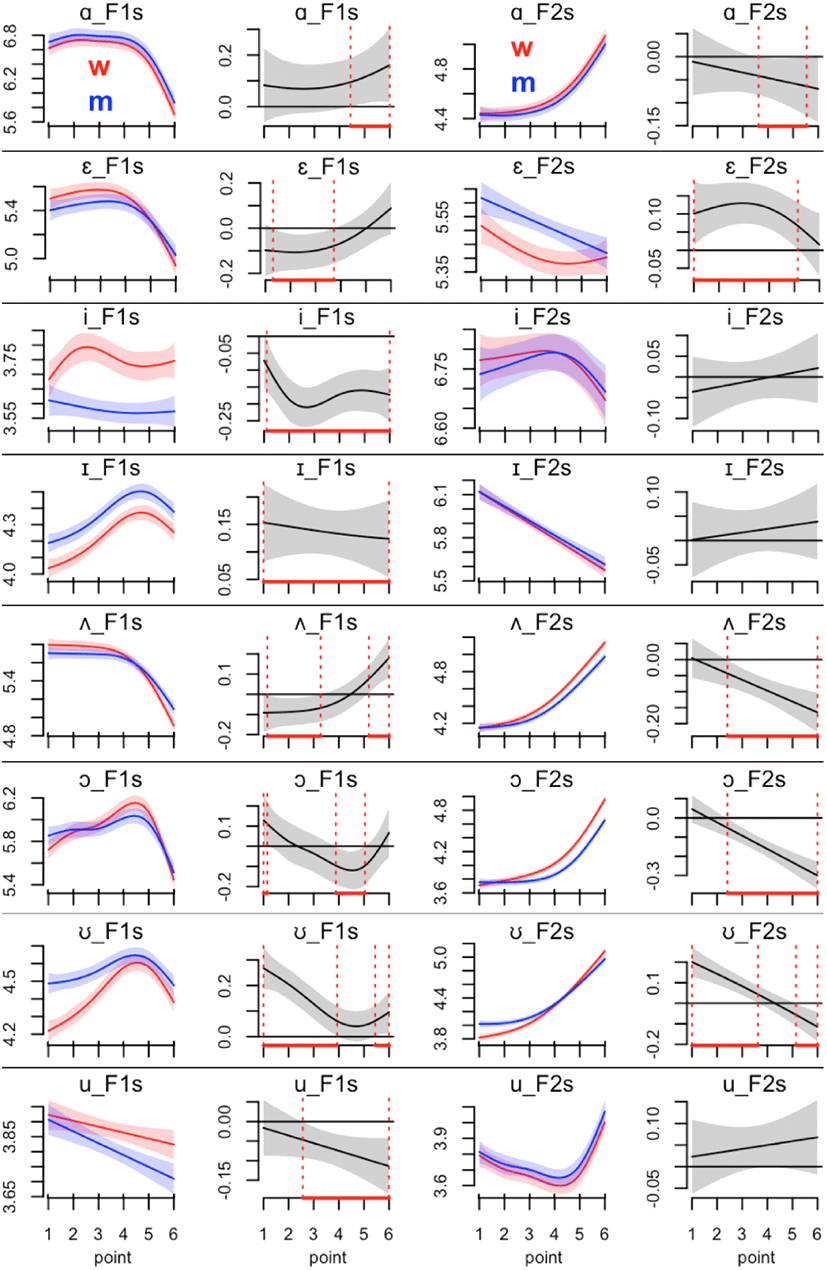
In F1s of the vowel /a/, there are no significant differences at points 1 to 4 but there are significant differences at points 5 and 6; in F2s there are significant differences at points 4 and 5. F1s values for the vowel /ε/ show significant differences at points 2 and 3, while in F2s values, all points except point 6 are significant. The vowel /i/ has significant patterns similar to those of /I/: F1s of the vowel shows significant difference, while F2s does not. The curviness of the vowel trajectories of women appear more dynamic with more vertical movement than that of the vowel /i/ of men. It is interesting to see the parallel trajectories of man and woman’s F1s values, which might be further scaled within the vowel /I/. The patterns match quite nicely. Further studies on scaling by a separate scaling factor for the vowel formants of men and women might be interesting. Perceptual tests of the synthesized vowels would validate scaling methods. F1s for the vowel /Λ/ shows a significant difference at points 1 to 3 and 6, while F2s does at points 3 to 6. In F1s of the vowel /ɔ/, points 1, 4 and 5 are significantly different; in F2s, points 3 through 6 are significantly different. F1s and F2s of the vowel /℧/ show the same significantly different points (i.e., significant at points 1 to 3 and 6 but not at points 4 and 5). Again, the women produced the vowel /℧/ with more dynamic gesture in F1s. Finally, for the vowel /u/, there is a significant difference at points 3 to 6 in F1s but not in F2s. On an average there are around 66.7% significantly different points (36 out of 54) in F1s. In F2s, there are 46.3% significantly different points (25 out of 54). Thus we can say that more group difference exists in F1s. In addition, the difference points are evenly distributed along the six time points of the nine vowels in F1s but in F2s the difference points are negatively skewed.
From the figures, we hypothesize that women produced vowels with more dynamic gestures in both the vertical and horizontal axes than men. Additionally, more dynamic gestures were observed in F1 than in F2, which might be related to the higher formant values of the women whose vocal tracts are anatomically shorter. The scale function in R successfully normalizes the data but still leaves some room for improvement. We can see in Figure 6 that, for the women, the F2s of some vowels such as /i/, /I/, and /u/ exactly match those of the men. On the other hand, the F1s in the vowel /I/ shows a parallel shift between the two groups. Here the sufficient number of the participants might be related to a smooth overlap of the data. If we had fewer participants, then the scaling would be biased. Randomly sampling some of the data and applying the same procedure to find the confidence interval with a method such as bootstrapping might correct the bias. Bootstrapping was introduced by Efron (1979) and can be used to estimate quantities associated with the sampling distribution of estimators and test statistics. Further studies would be desirable to determine if dynamic gestures could lead to perceptually salient productions indicating sex differences.
We would like to mention issues in the statistical interpretation of GAMMs and the acoustical scale used here. The significance testing on the curvilinear contour may be much trickier because of the potential complexity of smooth interactions and constraints on the software packages (Sóskuthy, 2017). Furthermore, the transformation of acoustical values into bark or other auditory scales may shed light on a perceptual aspect of formant trajectories. Thus, caution is needed in the application of the method.
4. Summary and Conclusion
This study examined the formant trajectories of ninety-three American English speakers and statistically analyzed the differences in the trajectories using GAMMs. The sound files of Hillenbrand et al. (1995) were used to collect six formant values at the corresponding time points within each vowel segment. Some corrections and checks to obtain valid and reliable formant values were made by carefully observing the formant trajectories on the wideband spectrogram and by appropriately setting the number of the formants in Praat. The results showed that the women yielded the proportionately higher formant values than the men. The standard deviations of each group showed separate patterns at the F1 and F2 axes and at six time points. Thus, the scaling function in R was used to normalize each formant data separately within each group.
Then, GAMMs were applied to the data to find significant differences at the measurement points. Generally, more group difference exists in F1 than in F2. Also, the woman’s trajectories appear more dynamic along the vertical and horizontal axes than those of the men. Additionally, there were curves parallel to the vowel /I/, which may need further scaling within the vowel set. We conclude that the scaling function and the nonlinear testing GAMMs in R are useful tools to pinpoint sex group differences within formant trajectories.
This study could be applicable to future studies that extend not only to a specific language or dialect but also to a comparison of native and non-native speech. For example, subtle changes in the formant trajectories of native and non-native speakers’ production of vowels may lead to interesting findings and applications, such as the establishment of better teaching plans or practices. Specifically, teachers may ask students to modify their jaw and tongue gestures to approximate those of native speakers in a timely manner watching their formant trajectories.