


1. Introduction
The present study aims to investigate several of the factors affecting articulation rate in a corpus of Seoul Korean spontaneous speech. Human speech does not show a consistent speech rate, which varies within speakers (e.g., by phrase length, discourse complexity, and mood) and between speakers (e.g., by gender, age, region of origin, education, and occupation). The present study examined speakers’ age, gender, and variations in individual articulation rate within a corpus produced by 40 Seoul Korean speakers.
Most studies dealing with speech rate concern speaking rate and articulation rate. Speaking rate is measured including silent intervals (i.e., pauses), whereas articulation rate is measured following the removal of pauses (Amir & Grinfeld, 2011; Crystal & House, 1990; Dankoviccova, 1997; Goldman-Eisler, 1968; Grosjean & Lane, 1974; Kendall, 2009; Miller et al., 1984; Quene, 2008; Robb et al., 2004). In the present study, the articulation rate was calculated as the duration between pauses in the speech corpus.
The gender and age characteristics of speaking rate and articulation rate that are of interest must be those that are operative in spontaneous speech in particular. With regard to gender, most available previous studies suggest that men speak faster than women do (Byrd, 1994; Jacewicz et al., 2009, Jacewicz & Fox, 2010; Kendall, 2009; Kim, 2017; Quene, 2008; Stepanova, 2011; Verhoeven et al., 2004; Whiteside, 1996; Yuan et al., 2006). Verhoeven et al. (2004) investigated the speaking rate and articulation rate in two standard national varieties of Dutch from a database produced by 160 speakers. The independent variable of gender was significant. Men’s articulation rate was 4.79 syllables/second, women’s 4.50 syllables/second, while men’s speaking rate was 4.23 syllables/second and women’s 4.01 syllables/ second. This indicates that men speak 6% faster than women. Jacewicz et al. (2009) reported on a study comparing the articulation rate between speakers of northern and southern American English. The differences in articulation rate by gender were very small, but, as a general tendency, men spoke slightly faster than women. In informal talk, the articulation rate for men was 5.2 syllables/second and that for women was 5.03 syllables/second. In reading, the articulation rate for men was 3.48 syllables/second and that for women was 3.33 syllables/second. The statistical results were significantly different for articulation rates between men and women, but the effect size was very small. Stepanova (2011) presented an analysis of Russian spontaneous speech rate on the basis of 40 speakers and their interlocutors. There were statistically valid differences in speech rate between men and women, indicating that men speak faster than women. Kim (2017) found speakers’ gender differences in spontaneous Seoul Korean speech, showing that males speak faster than females.
On the other hand, no gender differences in speaking rate and articulation rate were found in other studies (Block & Killen, 1996; Kowal et al., 1975; Robb et al., 2004; Walker, 1988). Robb et al. (2004) examined speaking rates of 80 adult native speakers of the American and New Zealand varieties of English. For both speaking rate and articulation rate, there was no significant difference between male and female speakers.
With regard to age, a number of previous studies found that young speakers speak faster than older speakers do (e.g., Jacewicz et al., 2009; Quene, 2008; Ramig, 1983; Smith et al., 1987; Verhoeven et al., 2004; Yuan et al., 2006). Yuan et al. (2006) investigated whether speaking rate in a database of conversational telephone speech in English and Chinese was affected by certain factors. One of their findings was that old speakers generally have slower speech than young speakers. Quene (2008) investigated several factors influencing articulation rate on the basis of a corpus of spontaneous Dutch produced by 160 speakers from the Netherlands and Flanders. It was found that the phrase length decreases with speaker’s age, and it was indicated that older speakers tend to vary their phrase length more than younger speakers. Jacewicz et al. (2009) showed that for northern (Wisconsin) and southern (North Carolina) speakers of American English, northern young adults tend to speak faster than northern older adults in both reading and informal speech. For northern young and old adults, the statistical results were distinctive but the effect size was small. However, southern young adults show a tendency to speak faster only in reading tasks but not in informal speech. That is, in reading, young adults’ articulation rate was 3.58 syllables/second and old adults’ articulation rate was 3.23 syllables/second, indicating that the young adults’ articulation rate was 11% faster than the old adults’. In informal speech, there were no differences in articulation rate between southern young and old adults.
What is interesting about the study of Jacewicz et al. (2009) was that for the interaction of age and gender, young men and young women showed greater differences in articulation rate than did old men and old women. Southern young men in reading spoke 17% faster than young women did, whereas older men and older women did not show a significant difference in articulation rate.
During spontaneous speech, speakers often produce speech at varying articulation rates. One of the variations that have received particular attention in previous studies (e.g., Goldman-Eisler, 1961, 1968; Jacewicz & Fox, 2010; Kim, 2017; Miller et al., 1984; Tsao & Weismer, 1997; Tsao et al., 2006) is individual articulation rate. Miller et al. (1984) examined the variation in the articulation rate of individual speakers based on interviews with 30 speakers. They showed that the articulation rate for individual speakers varied considerably in terms of average syllable duration (i.e., seconds per syllable). Specifically, the mean rate was 216 ms/syllable and the average standard deviation was 67 ms/syllable, showing a coefficient of variation of 31%. Tsao et al. (2006) tested whether some individual speakers habitually speak faster or slower than others. The experiment was conducted by 30 speakers divided into two groups of the habitually fast and habitually slow. The result was statistically significant differences between the fast and slow groups. This finding implies that there is a biological basis for rate differences between speakers. Jacewicz et al. (2010) characterized the articulation rate to account for both between-speaker and within-speaker variation in a database of the northern and southern varieties of American English. They pointed out that individual speakers showed a significant variation in their average rate. Moreover, both the variation between speakers and that within speakers appeared in the phrase length, and within-speaker variation was greater than the between-speaker variation. Kim (2017) investigated the variance of speech rate in spontaneous Seoul Korean speech. The result showed that individual speakers’ speech rates were significantly different on a basis of the effect of utterance length.
In order to quantify speakers’ rates, the study of Amir & Grinfeld (2011) suggested the term metric as a methodological factor. In general, early studies measured speaking rate with a word-per- minute metric (Duchin & Mysak, 1987; Johnson, 1961). The syllable-per-second and phone-per-syllable metrics are used by evaluating speaking rate and articulation rate to find the effect of word length and syllable structure (Hall et al., 1999; Walker et al., 1992). The phone-per-syllable rate is considered more appropriate for reflecting motor abilities (Perkins et al., 1979). For measurements of articulation rate, the syllable-per-second metric (e.g., Amir & Grinfeld, 2011; Sturm & Seery, 2007) and the second-per-syllable metric (e.g., Crystal & House, 1990; Goldman-Eisler, 1968; Miller et al., 1984) are regarded as more appropriate. One of the goals of the present study is to address whether the different metrics provide different contrasts related to gender, age, and individual differences. Hence, the present study computes the articulation rate using the syllable-per-second and second-per-syllable metrics.
As already discussed regarding previous studies, the present study seeks to examine several factors (e.g., gender, age, and individual differences) affecting the articulation rate using a corpus of Seoul Korean spontaneous speech. The present study includes three research questions. First, is there a gender difference in articulation rates in the spontaneous speech in the Seoul Korean corpus? Second, are there age group differences? For the present study, the corpus of Seoul Korean spontaneous speech was divided into four age groups (i.e., the age groups of 10–19, 20–29, 30–39, and 40–49 years). Older speakers (e.g., the 40–49 age group) might vary their articulation rates more than younger speakers (e.g., 10–19 age group). Finally, are there any individual differences when speakers produce spontaneous speech? That is, the assumption of the present study is that speakers significantly alter their articulation rates in spontaneous speech, yielding between-speaker variation.
In addition, the present study compared the results obtained from the two metrics (i.e., syllable per second vs. second per syllable), as the different metrics might produce similar results in Seoul Korean spontaneous speech, or one metric might trigger more significant differences in gender, age, and individual speakers than the other. The present paper investigates this point using the different metrics.
2. Method
The 40 speakers were obtained from a Korean corpus of spontaneous speech (Yun et al., 2015). The subjects are Seoul speakers who were born, raised, and spent most of their lives in Seoul and the Gyeonggi region. The information on the age and gender of speakers is shown in Table 1. All the speakers were paid volunteers.
As stated above, the present study analyzes the data drawn from a Korean corpus of spontaneous speech that contains spontaneous speech obtained through 40 individual speaker interviews. The interviewer asked speakers about a variety of topics based on the socio-linguistic approach. Speakers expressed their opinions on each question in the interviews.
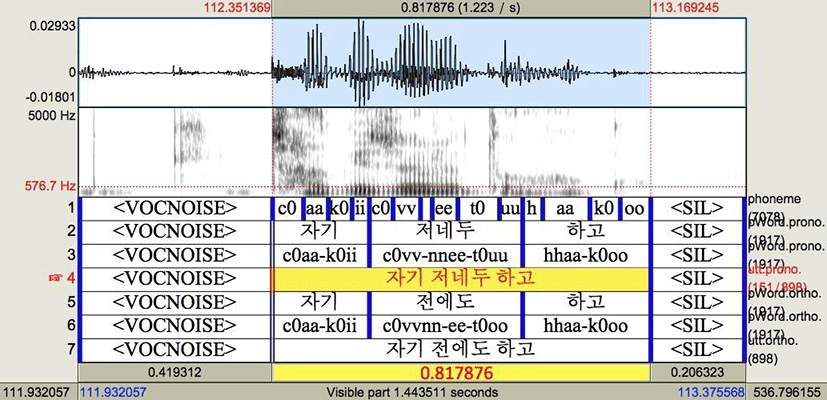
Figure 1 shows a speech sample chosen from the Korean corpus of spontaneous speech. In the speech sample of Figure 1, the articulation rate is computed using the phrase length (i.e., the duration of interpausal phrases) except for non-linguistic elements. The phrase shown in Figure 1 is [dʒɑ.ki#dʒʌn.e.tu#hɑ.ko] ‘do before I go to bed’. The duration of this phrase is 0.817876 seconds, and this phrase includes seven syllables. The articulation rate is measured with two metrics, syllables per second (syll/sec) and seconds per syllable (sec/syll). (1) and (2) as shown below are the articulation rates calculated by the two metrics.
(1) Articulation rate using the syllable-per-second metric:8.558 syllables / second=7 / 0.817876
(2) Articulation rate using the second-per-syllable metric: 0.116 seconds / syllable=0.817876 / 7
In Figure 1, <VOCNOISE> and >SIL>, which are non-linguistic elements, are not considered when measuring articulation rate of this phrase duration. The duration of <VOCNOISE> is 0.419312 seconds and the syllable number is 0. The duration of 0.206323 seconds and the syllable number is 0. Therefore, for the measurement of articulation rate in the corpus, non-linguistic elements such as <IVER>, <LAUGH>, <NOISE>, <SIL>, and <VOCNOISE> are excluded.
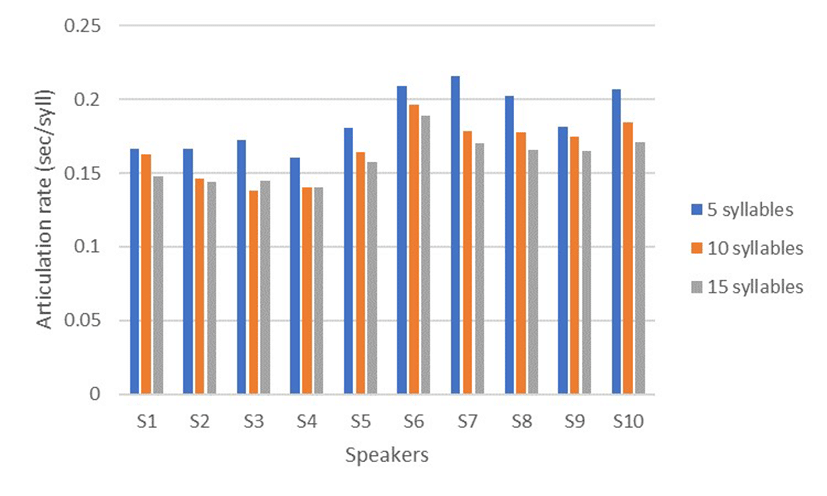
In the present analysis, the dataset consists of the three groups of syllables selected in the corpus: 5 syllables, 10 syllables, and 15 syllables. Table 2 shows the frequency of 5 syllables, 10 syllables, and 15 syllables produced by each speaker from the Korean corpus of spontaneous speech. 5 syllables, 10 syllables, and 15 syllables were obtained as the duration of interpausal phrases. These represent the durations of the phrases from which the articulation rate was computed.
For the present study, speakers’ articulation rates were assessed by a mixed-effect linear regression model using the lmer function in the lme4 package (Bates et al., 2015) in R (version 3.2.2). The dependent values are articulation rates measured by the syllable- per-second metric and the second-per-syllable metric. The fixed-effects predictors are gender, age, and individual speakers. In order to analyze the age differences, the ages were divided into four groups. That is to say, there are the age groups of those aged 10–19, 20–29, 30–39, and 40–49.
The Markov Chain Monte Carlo (MCMC) package (Martin et al., 2011) in R was used to calculate the p-values for the articulation rate of each speaker. In order to examine individual variations more closely, the coefficient of variation (CV) was calculated for the articulation rate of each speaker. The coefficient of variation is the ratio of the standard deviation to the mean. The present analysis compares the degree of variation in speakers’ articulation rates.
3. Results
Regarding gender differences for all speakers, the articulation rate was statistically distinctive for both the second-per-syllable metric (β=–0.017, t=–5.113, p<.001) and the syllable-per-second metric (β=0.691, t=5.641, p<.001).
To investigate the relation of gender and age differences, the articulation rate distinguished by gender was also assessed in terms of four age groups of speakers. The statistical assessment was conducted for the three groups (i.e., 5 syllables, 10 syllables, 15 syllables) divided by the number of syllables. For 5 syllables produced by the 10–19 age group, there was a significant effect of gender for both the second-per-syllable metric (β=–0.033, t=–5.037, p<.01) and the syllable-per-second metric (β=1.141, t=7.829, p<.001). This age group showed a significant difference by gender in 10 syllables (i.e., second per syllable: β=–0.031, t=–4.737, p<.01, syllable per second: β=1.246, t=5.297, p<.001) and in 15 syllables (second per syllable: β=–0.025, t=–4.758, p<.01, syllable per second: β=1.092, t=6.218, p<.001).
Males in the 10–19 age group showed different effects on articulation rates than did females. In 5 syllables, the mean articulation rate of males is 0.1692 for the second-per-syllable metric and 6.357 for the syllable-per-second metric, while that of females is 0.2031 for the second-per-syllable metric and 5.215 for the syllable-per-second metric. In 10 syllables, the mean articulation rate of males is 0.1503 for the second-per-syllable metric and 6.935 for the syllable-per- second metric, while that of females is 0.1821 for the second-per- syllable metric and 5.689 for the syllable-per-second metric. In 15 syllables, the mean articulation rate of males is 0.1469 for the second-per-syllable metric and 7.036 for the syllable-per-second metric, while that of females is 0.1721 for the second-per-syllable metric and 5.943 for the syllable-per-second metric. The mean articulation rates for males and females differed depending on the phrase duration. Males’ articulation rates were faster than those of females in the age group of 10–19.
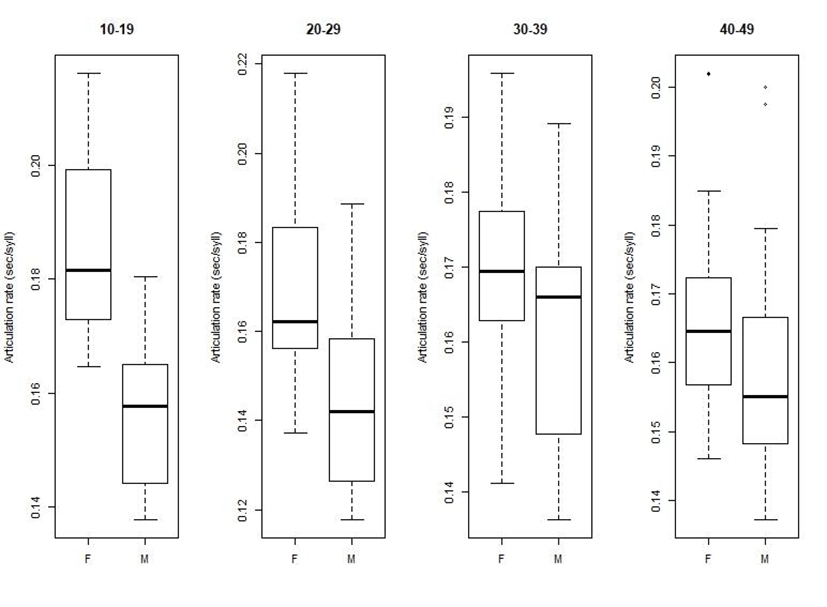
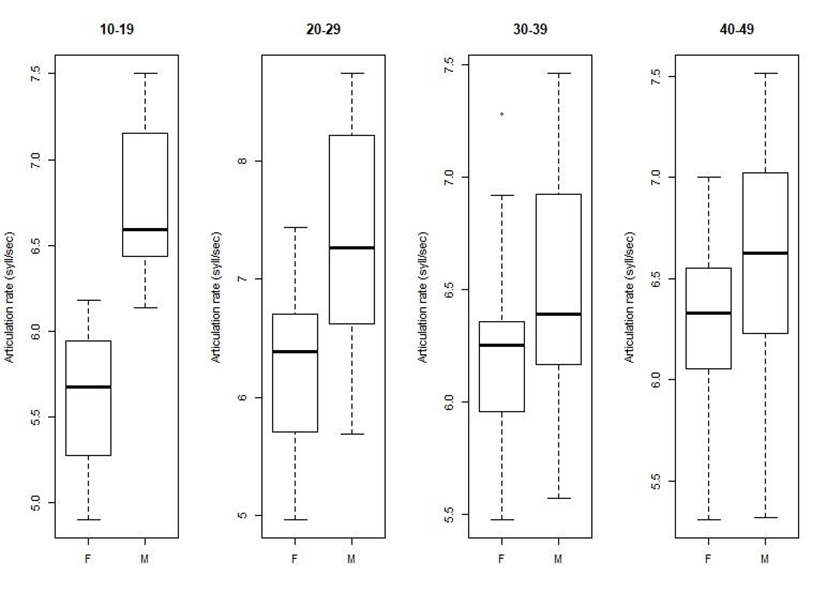
On the other hand, the articulation rates for the other age groups (i.e., 20–29, 30–39, 40–49) did not show a significant difference by gender for either metrics of seconds per syllable or syllables per second: Males’ articulation rate was not statistically different from females’. On the basis of this analysis, we can say that the younger age group tended to display a greater importance of gender than the older groups in the corpus of Seoul Korean spontaneous speech. As shown in Figures 2 and 3, the range of articulation rates for the 10–19 age group shows a large difference between males and females regardless of metric, while the ranges of articulation rates for males and females in the older groups overlap, indicating a lack of sensitivity to gender. The amount of overlap between males and females is larger for the 40–49 age group than for the 20–29 age group.
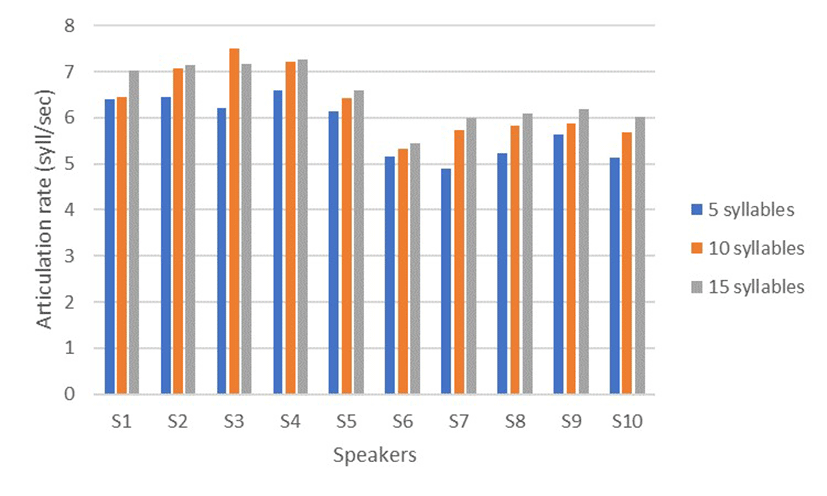
The differences and similarities in articulation rates across speakers were measured by the two metrics. For the 10–19 age group, the second-per-syllable metric showed significant differences for some speakers. S1 was statistically different from S6 (β=0.039, t=3.155, p<.01), S7 (β=0.029, t=2.358, p<.05), and S10 (β=0.028, t=2.293, p<.05) but showed a similar rate as the other speakers. Figure 4 shows these statistical values for all speakers of the 10–19 age group. Specifically, Figure 4 indicates that the articulation rates for S6, S7, and S10 are lower than those of the other speakers regardless of the phrase duration.
Articulation rate measured by the syllable-per-second metric exhibits stronger statistical effects. The articulation rate of S1 significantly differed from S6 (β=–1.313, t=–3.886, p<.001), S7 (β=–1.078, t=–3.192, p<.01), S8 (β=–0.907, t=–2.686, p<.05), S9 (β=–0.721, t=–2.133, p<.05), and S10 (β=–1.014, t=–3.000, p<.01). Figure 5 presents these statistical values. We observe that S1’s articulation rate is similar with that of S2, S3, S4, and S5, but Figure 5 shows that the articulation rate of S1 is greater than those of S6, S7, S8, S9, and S10.
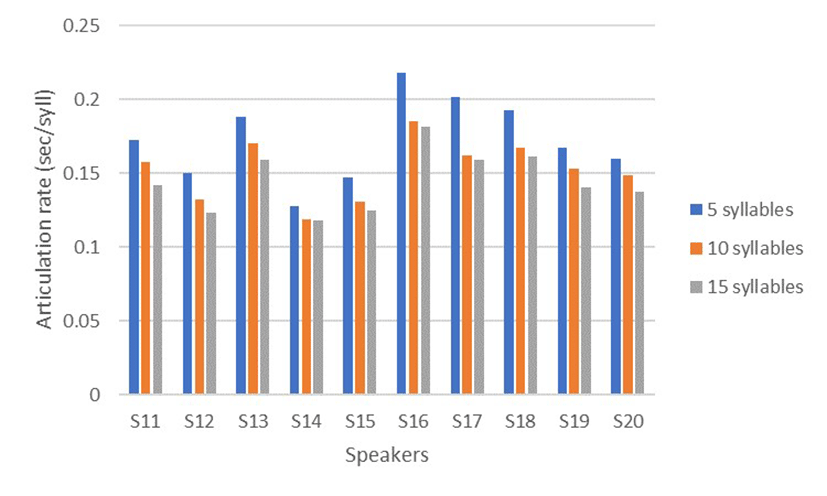
For the 20–29 age group, the articulation rate of S11 using the second-per-syllable metric showed statistically significant differences from S14 (β=–0.036, t=–2.879, p<.01) and S16 (β=0.037, t=2.996, p<.01). Figure 6 exhibits the irregular patterns of articulation rate across all speakers, but the graphs of S1 differ in articulation rate from S14 and S16: The articulation rate of S14 is much higher than that of other speakers, as shown in Figure 6.
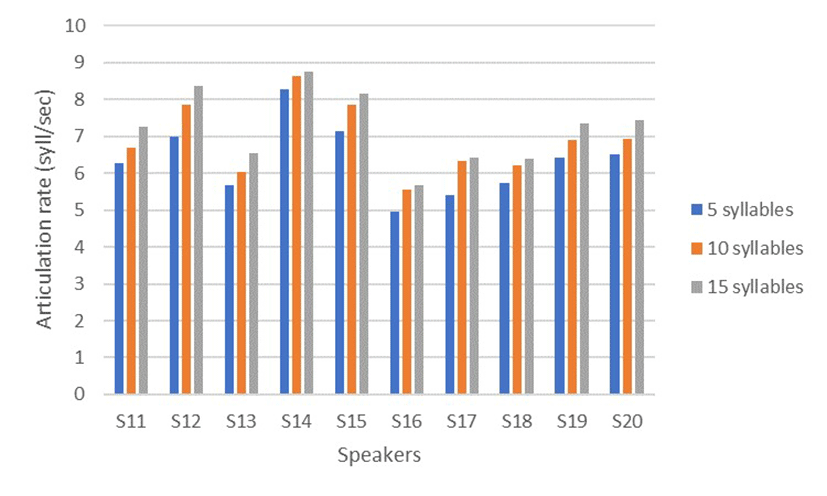
Using the syllable-per-second metric, S11 statistically significantly differed from S12 (β=1.086, t=2.703, p<.05) and S15 (β=1.062, t=2.644, p<.05), as well as S14 (β=1.906, t=4.746, p<.001) and S16 (β=–1.250, t=–3.113, p<.01) in articulation rate. The other speakers revealed no significant differences in articulation rate. Figure 7 shows faster rates for S12, S14, and S15 than the other speakers. The articulation rate for S14 is the fastest among speakers by the means of both metrics.
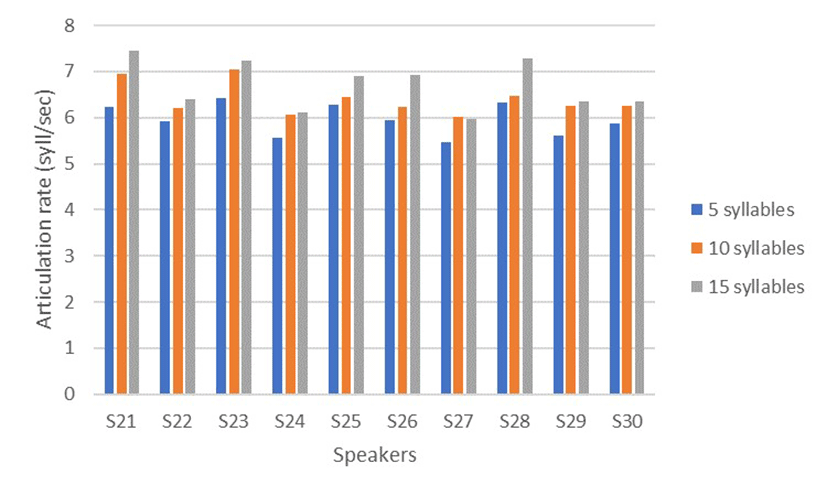
For the 30–39 age group, the articulation rate of S21 using the second-per-syllable metric was significantly different from that of S24 (β=0.025, t=2.264, p<.05) and S27 (β=0.028, t=2.563, p<.05). S21’s articulation rate did not show a significant difference from that of the other speakers. As seen in Figure 8, in 5 syllables, the articulation rates for most speakers were between 0.15 and 0.2. S24 and S27 show more or less slower rates than other speakers. The rate patterns in 10 syllables and 15 syllables exhibit the same similarities as for 5 syllables. S24’s articulation rate in 15 syllables was a little faster than in 10 syllables, but S27’s rate in 15 syllables was a little slower than in 10 syllables.
Using the syllable-per-second metric, S21 was significantly different from S22 (β=–0.702, t=–2.113, p<.05), S29 (β=–0.802, t=–2.414, p<.05), and S30 (β=–0.710, t=–2.137, p<.05), as well as S24 (β=–0.953, t=–2.870, p<.01) and S27 (β=–1.054, t=–3.173, p<.01) in articulation rate. On the other hand, the articulation rate of S21 shows a dissimilarity to that of the other speakers. In Figure 9, the articulation rate of S21 is faster in all syllables than that of S22, S24, S27, S29, or S30.
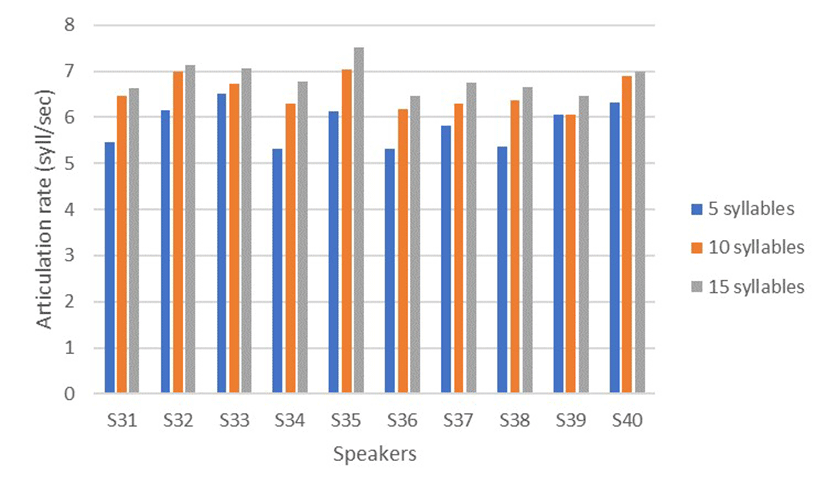
For the 40–49 age group, there were no significant differences in articulation rate across speakers by either the second-per-syllable or syllable-per-second metric. The statistical values were computed by the mean of articulation rate for all 5 syllables, 10 syllables, and 15 syllables. However, as shown in Figure 10, the articulation rate is much slower for four of the speakers (S31, S34, S36, and S38) in 5 syllables, with a value of 0.2 using the second-per-syllable metric. For these four speakers, the articulation rate increases when the phrase length is 10 syllables and 15 syllables. These rate differences in 5 syllables need to be examined in future study. In addition, this rate pattern does not exactly correspond with that of the syllable-per-second metric, as shown in Figure 11.
On the other hand, Figure 11 shows that the articulation rate of S35 on 15 syllables is faster than for any other speakers, and S35’s rate in Figure 10 also tends to be faster for 15 syllables. However, for the 40–49 age group, the statistical analysis did not show any significant differences among individual speakers. Hence, the 40–49 age group tends not to show sensitivity to articulation rate using either metric.

With regard to variation on articulation rate, most available evidence suggests that there is substantial variation across speakers, as shown in Tables 3, 4, 5, and 6. The coefficient of variation is a statistical measure of relative variability that represents the standard deviation as a percentage of the mean.
Table 3 shows the coefficient of variation of individual speakers in the 10–19 age group. As shown in Table 3, using the second- per-syllable metric, the mean articulation rate of S4 is 0.1511 with a standard deviation of 0.034, yielding a coefficient of variation of 23%. Using the syllable-per-second metric, the mean articulation rate of S4 is 6.912 with a standard deviation of 1.364, for a coefficient of variation of 20%. The articulation rate of S4 is the fastest among speakers on both metrics. S4 exhibits the smallest coefficient of variation among individual speakers on both metrics in the 10–19 age group.
S3, S5, and S6 show values of 36%, 36%, and 37%, respectively, using the second-per-syllable metric, yielding high values of the coefficient of variation, but the coefficients of variation obtained for syllables-per-second are 25%, 28%, and 26%, respectively. The articulation rates for these speakers were found to be slower for the 10–19 age group.
Overall, when using the second-per-syllable metric, the coefficients of variation are higher than when using the syllable- per-second metric.
Table 4 shows the coefficients of variation of individual speakers in the 20–29 age group. Among male speakers, the coefficient value of variation for S14 is 29%, reflecting a mean articulation rate of 0.1294 and a standard deviation of 0.037 by the second-per-syllable metric, while by the syllable-per-second metric, the coefficient of variation is 22%, from a mean articulation rate of 8.202 and a standard deviation of 1.823. The values of the coefficient of variation for S14 are the least among male speakers, and the articulation rate of S14 is the highest in the 20–29 age group.
On the other hand, among female speakers, the mean articulation rate of S20 is 0.1563 and the standard deviation of S20 is 0.039, yielding a coefficient of variation of 25% by the second-per-syllable metric. Similarly, by the syllable-per-second metric the mean articulation rate of S20 is 6.743 and the standard deviation of S20 is 1.429, yielding a coefficient of variation of 21%. The articulation rate of S20 is the highest among female speakers.
The highest coefficient value of variation in the 20–29 age group is 36% for S18 using the second-per-syllable metric and 27% for S16 using the syllable-per-second metric. As the coefficient of variation increases, the articulation rate tends to be lower. The mean articulation rate of S18 is 0.181 with a standard deviation of 0.066 using the second-per-syllable metric, while the mean articulation rate of S16 is 5.193 with a standard deviation of 1.392 using the syllable-per-second metric.
The overall values of the coefficients of variation using the second-per-syllable metric are higher than those using the syllable- per-second metric in the 20–29 age group.
Table 5 shows the coefficients of variation of individual speakers in the 30–39 age group. When using the second-per-syllable metric, the mean articulation rate of S21 is 0.1541 with a standard deviation of 0.043, yielding a coefficient of variation of 28%. S21 has the highest articulation rate in the 30–39 age group, although the coefficient of variation is not the lowest among speakers. When using the syllable-per-second metric, the mean articulation rate of S21 is 6.871 with a standard deviation of 1.449, yielding a coefficient of variation of 21%. The articulation rate of S21 is the highest using the syllable-per-second metric.
The highest value of the coefficient of variation in the 30–39 age group is 36% for S26 using the second-per-syllable metric, with a mean articulation rate of 0.1815 and a standard deviation of 0.066. The coefficient of variation of S26 using the syllable-per-second metric is 29% with the highest value in the 30–39 age group, from a mean articulation rate of 6.078 and a standard deviation of 1.754. The variation for S26 does not show an equivalent result for both metrics, but the articulation rate of S26 is found to have a slower pattern.
The values of the coefficient of variation in the 30–39 age group show more variation using the second-per-syllable metric than the syllable-per-second metric.
Table 6 presents the coefficients of variation of individual speakers in the 40–49 age group. In this group, S32 and S33 exhibit higher articulation rates than the other speakers by the second- per-syllable metric, with mean articulation rates of 0.1565 and 0.1575 with standard deviations of 0.041 and 0.04, respectively. Their coefficients of variation are 26% and 25%, respectively. Using the syllable-per-second metric, the mean articulation rates of S32 and S33 are 6.742 and 6.668 with standard deviations of 1.35 and 1.422, yielding the coefficients of variation of 21% and 20% respectively.
In this group, the mean articulation rate and coefficient of variation are not consistent across the two metrics. For example, the coefficient of variation for S35 is 38% using the second-per-syllable metric and 28% using the syllable-per-second metric. These values of the coefficient of variation do not reflect the slowest articulation rate of S35 in this age group. Also, when using the syllable- per-second metric, four speakers have a coefficient of variation of 21%. In other words, in this age group, speakers tend to have similar articulation rates.
As with the other age groups, in general the coefficients of variation are much higher using the second-per-syllable metric than using the syllable-per-second metric. It is suggested that the different metrics reflect different kinds of individual variations.
4. Discussion and Conclusion
The present study examined the variations in articulation rates in Seoul Korean spontaneous speech as a function of gender, age, and individual differences. The present results indicate that there were age differences in gender and individual variations in articulation rate in the spontaneous speech of Seoul Korean. The 10–19 age group showed a significant effect of gender on both metrics regardless of phrase length. It was found that men tended to speak faster than women. On the other hand, the other age groups did not show a significant difference by gender. Regarding individual differences, there were significant effects in articulation rate for the 10–19, 20–29, and 30–39 age groups, but the 40–49 age group showed no significant variation in individual speakers’ articulation rates. Finally, there were differences by metric when analyzing the articulation rates of individual speakers. The syllable-per-second metric distinguished individual variations better than the second- per-syllable metric.
In the present study, not all of the age group showed gender differences in articulation rate. Only the 10–19 age group showed a significant effect of gender, indicating that men speak faster than women do in this group. This finding was observed when articulation rate was quantified using both the syllable-per-second metric and the second-per-syllable metric. For the other age groups, there were no significant effects of gender on articulation rate. The younger age group tended to have a more significant effect of gender than the older groups (i.e., 20–29, 30–39, 40–49) in spontaneous Seoul Korean speech.
As pointed out in a number of studies, men speak faster than women do (e.g., Jacewicz et al., 2009; Stepanova, 2011; Verhoeven et al., 2004). The present study supports this fact, reporting that young men aged 10–19 produced faster speech than young women aged 10–19. However, the effects of gender were less consistent for the older age groups. Some previous studies failed to show statistically significant differences by gender in articulation rates (Block & Killen, 1996; Kowal et al., 1975; Robb et al., 2004; Walker, 1988).
The present study reported that articulation rates varied across individual speakers. The individual variations appeared with both the syllable-per-second and second-per-syllable metrics, but the individual differences were higher when using the syllable- per-second metric. For example, in the 20–29 age group, S11 showed statistically significant differences from S14 (p<.01) and S16 (p<.01) using the second-per-syllable metric. On the other hand, using the syllable-per-second metric, S11 significantly differed from S12 (p<.05) and S15 (p<.05) as well as S14 (p<.001) and S16 (p<.01). For the 10–19 and 30–39 age groups, the variability of individual speakers in articulation rate was more distinct when using the syllable-per-second metric than the second-per-syllable metric. However, there was no significant difference across individual speakers in the 40–49 age group by either metric. That is, the older speaker group did not show the individual variability of the younger speakers’ group. Yuan et al. (2006) indicated that old speakers generally speak more slowly than young speakers. This implies that the individual speakers in the old speakers’ group are less variable in their articulation rates than those in the young speakers’ group.
The tendency for some speakers to speak faster than other speakers may be variable, but in the present study, the rate of articulation of one particular speaker was much higher than for the other speakers. In other words, the articulation rate of S14 was the fastest by both metrics across all speakers: 0.1294 seconds/syllable with a standard deviation of 0.037 and 8.202 syllables/second with a standard deviation of 1.823. The tendency for one speaker to speak significantly faster than the other speakers was also found in other studies (Goldman-Eisler, 1961; Jacewicz & Fox, 2010; Miller et al., 1984; Tsao et al., 2006). Tsao et al. (2006) showed that some individual speakers habitually speak faster or slower than other speakers. These individual speakers thus display speaker-specific articulation rates (Jacewicz & Fox, 2010).
The present study calculated the coefficient of variation of the articulation rates of individual speakers. Overall, the coefficient of variation was higher for the second-per-syllable metric than for the syllable-per-second metric. The coefficient of variation tended to be variable between individual speakers across all age groups. For example, in the 10–19 age group, S4 showed the smallest coefficient of variation, 23% for seconds/syllable and 20% for syllables/ second. S6 showed the highest coefficient of variation, 37% for seconds/syllable. The difference between the lowest and highest coefficients of variation was greater for the second-per-syllable metric than for the syllable-per-second metric. These coefficients of variation were in this sense consistent with their articulation rates. The articulation rates for S4 were 0.1511 seconds/syllable with a standard deviation of 0.034 and 6.912 syllables/second with a standard deviation of 1.364. This articulation rate was the highest among speakers in the 10–19 age group. The articulation rates for S6 were 0.2044 seconds/syllable with a standard deviation of 0.075 and 5.334 syllables/second with a standard deviation of 1.413. The coefficients of variation were more or less consistent with their rates of articulation, but the differences in the coefficients of variation for the lowest and highest values among individual speakers may be variable across all age groups. For other age groups, the coefficients of variation for individual speakers tended to reflect the values of the articulation rates.
In conclusion, the rates of articulation and their coefficients of variation seemed to reflect speaker variability, though the values for the 40–49 age group should be excluded. The differences in the younger and older groups in articulation rates should be considered more specifically in future research. Furthermore, a justification of the observation that different metrics reflect differences in individual speakers needs to be provided with more sophisticated analyses in future studies.