1. Introduction
Acoustically, the source of speech or vocal fold vibration is measured by the fundamental frequency (Fant, 1973). Pitch refers to the fundamental frequency that emphasizes the perceptual dimension of a sound property (Zheng & Brette, 2017). Thus, people can easily determine the sex and age of speakers based on short utterances. Pitch is an essential component of high-quality speech synthesis. An examination on subtle pitch variations could enhance an understanding of the phonetic and phonological aspects of a language. Previous studies have reported several pitch measurements of males, females, and children (Peterson & Barney, 1952; Hillenbrand et al., 1995; Yang, 1990, 1996, 2009). Peterson & Barney (1952) listed the pitch values of ten vowels produced by 76 speakers. From their list, we obtained a grand mean pitch of 132 Hz for men, 223 Hz for women, and 264 Hz for children. Hillenbrand et al. (1995) recruited 139 American participants for the study and reported the mean pitch values of 130 Hz for the male group, 220 Hz for the female group, and 236 Hz for the child group. The average pitch values of the male and female groups of these two studies differ by just 2 to 3 Hz, and the 28-Hz difference of the child group may be considered small in light of their wide pitch ranges. The previous two studies collected the pitch values at the sustained vowel portion, which might lead to inconsistent measurements when the researchers visually selected one point at a given vowel segment. The formants of lax vowels usually change throughout the segments in the context of /hVd/, which makes the detection of any sustained vowel portion difficult. Additionally, because pitch generally rises and falls within a vowel segment, pitch values vary depending on the measurement point. In this regard, Hillenbrand et al. (1995:3102) remeasured 10% of the utterances and reported a frame-by-frame average absolute difference of 1.7 Hz and an average signed difference of 0.6 Hz. Yang (1990, 1996) reported the pitch values measured at time points proportionately to the whole vowel segment. Yang (1996) listed the average pitch values and standard deviations in parentheses as follows: American English male speakers, 130 (18) Hz; American English female speakers, 212 (21) Hz; Korean male speakers, 169 (25) Hz; and Korean female speakers, 269 (29) Hz. Thus, a comparison between different language groups may be possible by assuming that speakers tend to produce the components of the syllables of a given word in a temporally organized way. In other words, the speakers would assign similar ratios of durations to the onset, peak and coda of the given syllable depending on the rate of speech. Thus, their pitch trajectories would look similar regardless of the rate.
Elicitation methods may influence the pitch measurement. For example, Yang (2009) examined the pitch trajectories of English vowels produced by nine American males in clear and conversational speaking styles. He found that the participants produced the front and back vowels within a pitch range from 132 to 148 Hz for high-pitched clear speech and from 103 to 108 Hz for low-pitched conversational speech. The participants distinguished speaking style using pitch value. Generally, the participants produced tokens of a higher pitch for the clear speech mode, which indicates that pitch measurements may vary greatly depending on recording directions.
Pitch measurements are prone to errors and several attempts to collect valid and reliable values were made (Vogel et al., 2009; Wu et al., 2016; Yang, 2009). Generally, f0 values may vary according to software configuration, signal-to-noise ratio, acquisition environment, and sampling rate (see Vogel et al., 2009 for details). Vogel et al. (2009) analyzed 1,120 voice files using optimized case-by-case methods and compared the results of several automated analysis scripts within preset pitch range parameters. They reported that the results were comparable when pitch windows were appropriately selected to reflect population differences. Here, researchers may set window frame lengths that are small enough to prevent smoothing over a pitch variation within a short period of time (Gerhard, 2003). However, the length should also be long enough to capture complete cycles of periodic wave forms (Fette et al., 1980; Karnell et al., 1991). In addition, to attain valid pitch values, the pitch range should be set appropriately: if the pitch floor or ceiling were too high or too low, the chance of neglecting valid pitch values would increase. Wu et al. (2016) proposed a method to improve pitch estimation by enhancing harmonics. Their method is to regenerate harmonics from noisy signals by multiplying existing harmonics. In fact, a narrow-band spectrogram with visible harmonics can be a good guide for determining pitch values.
Several statistical tests have been done using pitch data or other data collected at one point of a vowel segment. However, comparisons easily miss the nonlinear characteristics of the linguistic nature. Some pitch values overlap within and across sex and age groups. These random effects that arise from individual participants may be misleading during a statistical comparison; the wide standard deviations of the previous studies support this idea. In Yang (1996), the standard deviations of the pitch values ranged from 18 to 29 Hz. The standard deviations of the data of the Korean speakers might be higher because the registers of the Korean speakers were comparatively higher than those of the American speakers. In addition, there are not many studies that have compared the pitch values of various groups obtained at several measurement points over time. This study attempts to compare curvilinearly varying pitch measurements along vowel segments. Generalized Additive Mixed Models (GAMMs) offer a solution for testing a statistical significance for that purpose (Sóskuthy, 2017; Wood, 2006). Basically, the test creates added functions to approximate curvilinear changes across time.
The main purpose of this study was to establish pitch data for American speakers and to apply the GAMMs to compare the collected values. Specifically, the current study was designed to investigate 1) pitch trajectories of American English men, women, and children, 2) a nonparametric statistical comparison of the pitch values of the four groups, and 3) a nonlinear trajectory comparison between boys and girls.
The methods of this study would be applicable to further linguistic research that extends not only to individual language changes over time but also to dialectal variations in general.
2. Method
According to Hillenbrand et al. (1995), a total of 139 American speakers participated in their recordings. To recap the demographic descriptions briefly, they were divided into three groups: 45 men, 48 women, and 46 ten- to twelve-year-old children. The child group consisted of 27 boys and 19 girls. All participants were screened to form a dialectally homogeneous group of people who could maintain the /ɑ/-/ɔ/ distinction and discriminate the minimal pairs along with other criteria.
The participants read the randomized list of 12 /hVd/ words. A digital audio recorder and a dynamic microphone were used to record their productions (see Hillenbrand et al., 1995 for detailed information on data acquisition). The researchers monitored the recording in order to secure the correct pronunciations of the participants. A total of 1,668 sound files were recorded.
The sound files and time_data.txt were downloaded online from http://homepages.wmich.edu/~hillenbr/voweldata.html. The time_data.txt file was edited to include only the participant’s group initial, number, the vowel names, and the starts and ends of the 1668 vowel segments. Praat (v.6.0.40, Boersma & Weenink, 2018) was used to obtain pitch values. The downloaded sound files were read into the window of Praat Objects using the folder reading script (Yang, 2009). Then, another script (see Appendix for the script) was created by modifying the analysis script to collect six pitch values at the proportionate time points within each vowel segment. The analysis script took the parameters from the time data and found the total duration of each vowel segment. The duration was divided by 5 to attain the six time points of the pitch measurements. The pitch parameters were set in the range from 75 to 600 Hz using the autocorrelation method. Considering previous studies on window length setting (Fette et al., 1980; Gerhard, 2003; Karnell et al., 1991), the window length was modified into a 45-ms window around each selected time point. From the script, the first time point was assigned a 45-ms window that started at the beginning of the vowel segment. The last time point was assigned a window of the same size that ended with the vowel segment (see Figure 2 in Yang, 2009). The window size was arbitrarily chosen to avoid undefined pitch values with shorter windows. However, the window size may have to be shorter to examine rapid pitch variations in detail in future research, and additional errors must be corrected manually. The name of the sound file, loop number, pitch values, and time points in the information window were appended to a text file. The pitch difference of the adjacent measurement points was calculated and added in the text file to inspect any sudden jumps or drops in the values due to using discrete signal processing within a selected window. A total of 10,008 values (1,668 vowels×6 measurements) were obtained.
Then, the author checked the validity of pitch values in Praat. The five columns of the value differences between adjacent columns among the six values were helpful to detect erroneous values. Some of these values were manually corrected by checking the original sound file and expanding the waveform around the time point to find the duration of each vocal fold cycle along with the lower harmonics visible on a narrow band spectrogram. Finally, another column was added in Excel to find the pitch value differences between adjacent columns among the six values to remedy any further errors after the manual correction.
3. Results and Discussion
The grand mean and standard deviation of the collected pitch values are 197 Hz and 52 Hz, respectively. A density curve and a histogram plot of the pitch values of all four sex and age groups are illustrated in Figure 1.
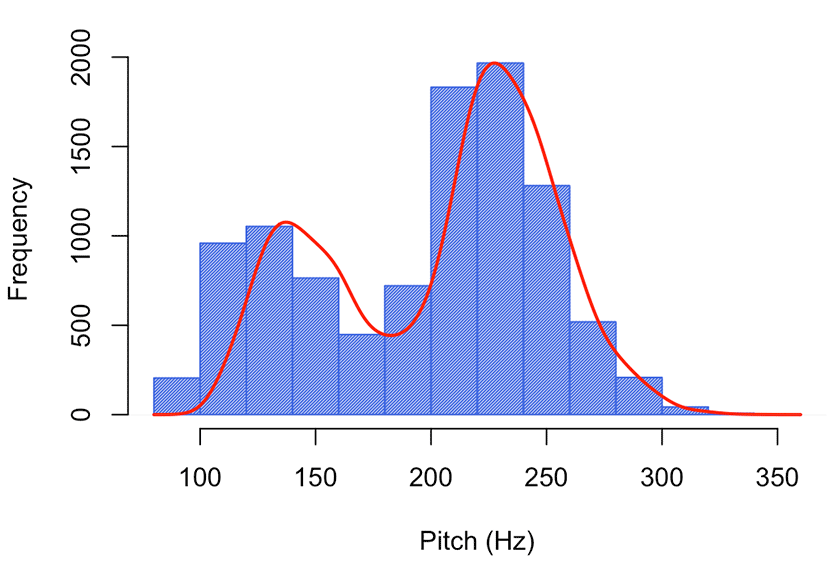
The density curve shows a bimodal distribution: the first peak of the frequency is at approximately 125 Hz and the second one is at approximately 225 Hz. This distribution may be related to the constitution of the four groups as well as the time points measured at the beginning and end of the vowel segments. The distribution is skewed to the right, which is partially because vocal folds have a naturally lower frequency but people can stretch their vocal folds to increase pitch (Lennes et al., 2016).
The distribution of the pitch values of the four sex and age groups is illustrated in Figure 2.
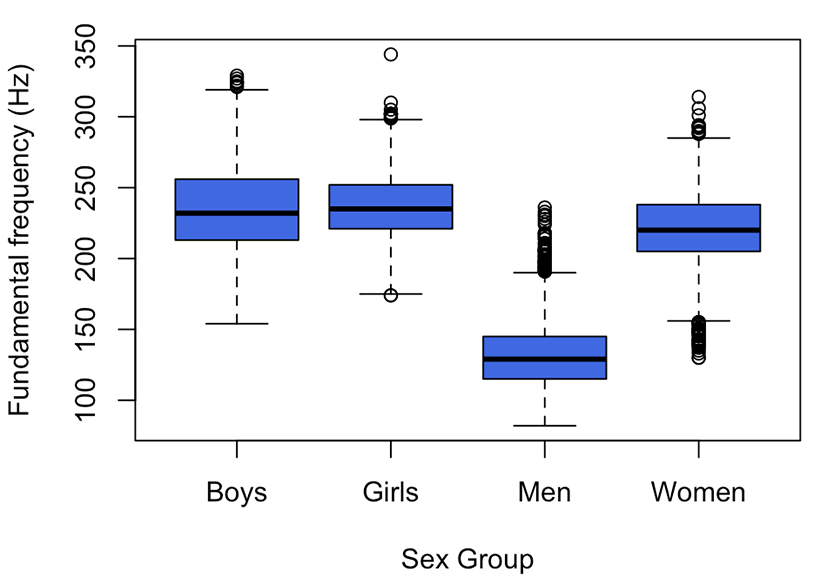
The mean pitch values and standard deviations (in parentheses) at the six time points of men, women, boys, and girls were 131 (23) Hz, 220 (26) Hz, 235 (29) Hz, and 237 (24) Hz, respectively. These mean values are comparable to those of Hillenbrand et al. (1995). The standard deviation is higher for boys than for men. Assuming that the speakers produced the words in a temporally organized way, we calculated the mean pitch values (and standard deviations) at the one-third time point of the vowel segment as follows: 130 (21) Hz for men, 222 (22) Hz for women, 236 (27) Hz for boys, and 241 (20) Hz for girls. These values may be applicable when non-native speakers are recruited to produce the same set of vowels for comparison in a future study.
The median is a midpoint of each group and marked by a thick line. The box includes 50% of the data, while the upper and lower whiskers show the remaining 50%. Outliers, which have values that are either 1.5 times the interquartile range above the upper quartile or 1.5 times the interquartile range below the lower quartile, appear as circles. From the figure, the highest pitch value in the group of girls is 344 Hz, which is g12’s vowel iy. The box plot reveals some outliers from the quartile ranges, which are mostly in the higher frequency region. Generally, men have the lowest pitch, followed by women, boys, and girls.
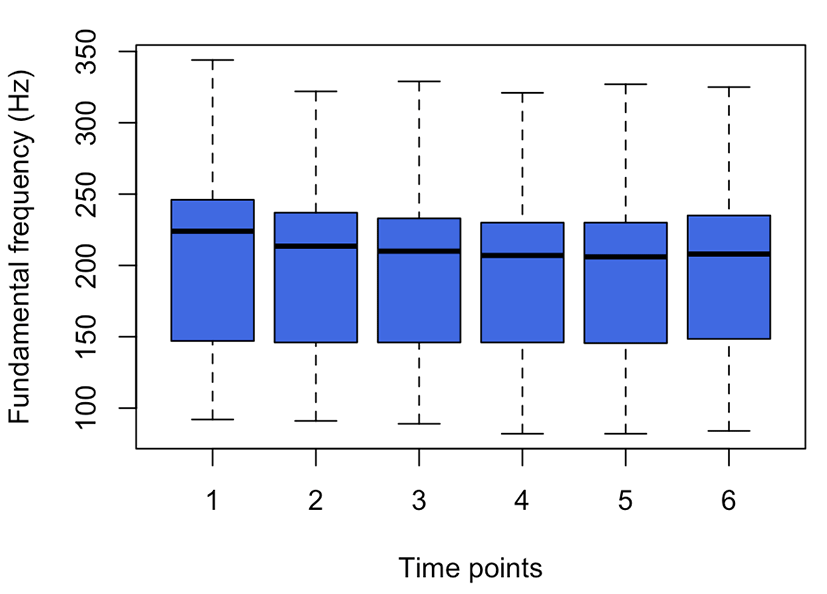
Next, the pitch values at six time points were plotted, as shown in Figure 3. The pitch values change gradually across the time points. From the 1st time point to the last, the mean pitch values are 204, 198, 195, 193, 193, and 196 Hz, respectively. The standard deviations are within the range from 51 to 55 Hz. The curve of mean pitch over time is shaped like a single dip. This pattern might be related to an intonation pattern of reading a list of words in English. The participants might have read the list of words with a very short rising tone at the end of each word until the falling tone of the last stimulus word.
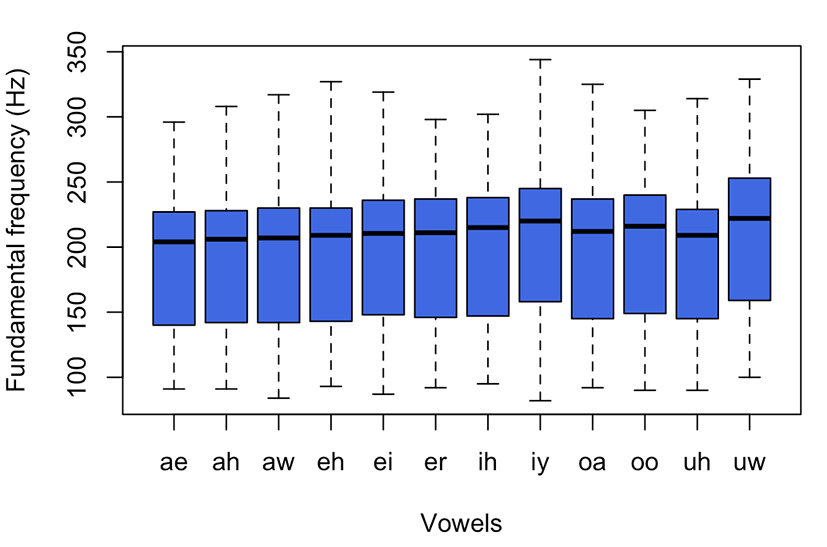
To examine if there is any difference in the pitch values by vowel group, Figure 4 illustrates the pitch distribution grouped by the vowels. As shown in the figure, there are slight differences. The vowel uw has the highest pitch mean (209 Hz) and the vowel ae has the lowest pitch mean (189 Hz); thus, the range is approximately 10 Hz. The eliciting environment of the production of vowels in the read speech style after practice might account for this short range. The mean pitch values of the other vowels are 190 Hz (ah), 192 Hz (aw), 192 Hz (eh), 195 Hz (ei), 197 Hz (er), 199 Hz (ih), 205 Hz (iy), 197 Hz (oa), 200 Hz (oo), and 193 Hz (uh). The standard deviations across the vowels showed a comparable range (50 to 54 Hz). Yang (1996) observed that pitch was lower for open vowels with higher F1, which relates to the vowel inherent pitch effect (Lehiste, 1967). Here, open vowels (i.e., ae, ah, and aw) have relatively lower pitch values than closed vowels (i.e., iy, oo, and uw).
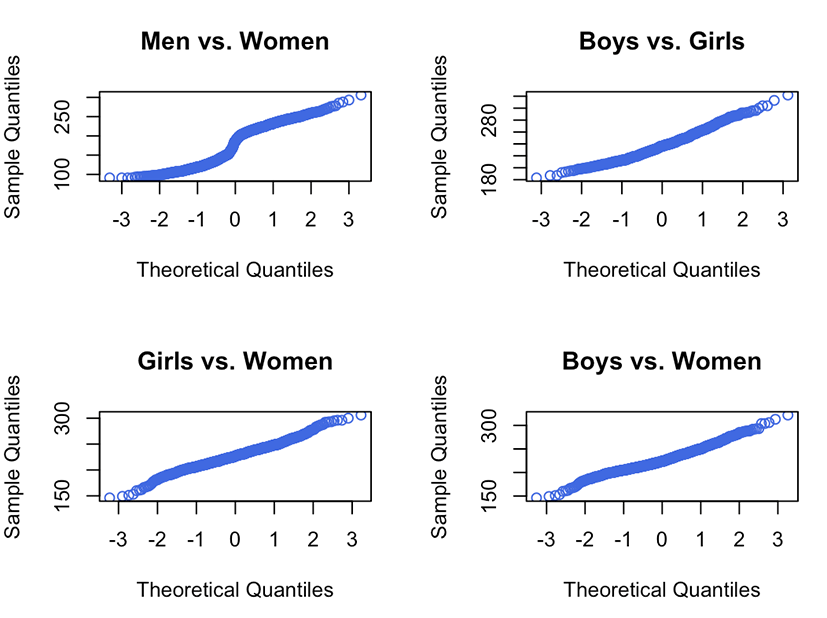
Basic statistics in the previous section showed that the pitch values of the four groups were quite different. A conventional statistical analysis method for pitch data measured over a sustained vowel portion is an analysis of variance of the sex and vowel groups followed by post-hoc tests. Here, we collected six pitch values for each vowel, which changed slowly from high to low pitch values and were measured repeatedly for each participant. Only pitch values at the second time point were chosen to evaluate the normality of pitch using a Shapiro-Wilk test (shapiro.test (x) in R) and a qqnorm plot (R Core Team, 2018). Figure 5 illustrates the qqnorm plots for a few possible combinations of the four sex and age groups.
Significant departures from the line were observed, which means there is a violation of normality. Additionally, the Shapiro-Wilk test results were significant (p<.05), thus rejecting the null hypothesis, which suggests that the data came from a population with a non-normal distribution. These results were expected when considering outliers in Figure 1. Thus, the nonparametric Wilcox test was applied to the data. Table 1 shows the statistical results.
| Groups compared | W | p-value |
|---|---|---|
| Men-women | 1,123 | <.05 |
| Men-girls | 123,090 | <.05 |
| Men-boys | 174,830 | <.05 |
| Women-boys | 69,047 | <.05 |
| Women-girls | 96,412 | <.05 |
| Boys-girls | 31,326 | 0.002 |
Table 1 indicates that all the combinations of the pitch values in the four groups were significant at p<.05. We can confirm that those pitch values were significantly different. The results might not be useful to support any hypothesis or theory because the speakers produced the words in a read speech and did not reflect any systematic variations under various elicitation methods.
Here, a question arises: What would be the statistical result on equivalent sets of curvilinearly varying pitch values between comparable groups (i.e., boys and girls)? Now, we will compare the varying slope for this purpose using the GAMMs (Wood, 2006; Sóskuthy, 2017).
When the time points were compared statistically, the following summary table was obtained (the values were rounded and the major terms were edited to save space):
The parametric coefficients in the summary above were obtained from a regression analysis of all the pitch values measured at the six time points without considering pitch contours. The smooth terms in the latter half of the analysis indicate that there are approximately 2 knots (see edf value 2.6 above), which should be considered significant boundaries. The deviance explained is 0.575%, which is very low but makes sense considering the vast pitch differences among the groups.
Now, we compared the four groups and obtained the following summary table:
Here, we can tell that the difference between each combination of the compared groups is statistically significant except that between the boys and the girls. The boys’ group was set as the reference here. The majority of the results support those of the nonparametric tests in the previous section. However, the group comparison between the boys and the girls was not significant like the overall significant difference shown in the time point comparison above.
Because we have seen a mismatch in the previous summary of the time points and the vowels for the boys and the girls, we further test the statistical significance in their pitch trajectories. Figure 6 illustrates a smooth plot for those two groups only. Generally, the pitch values of the girls start at higher values than those of the boys and then the values of the two groups converge around the third time point, then diverge slightly and run parallel in the latter half of the vowel segment.
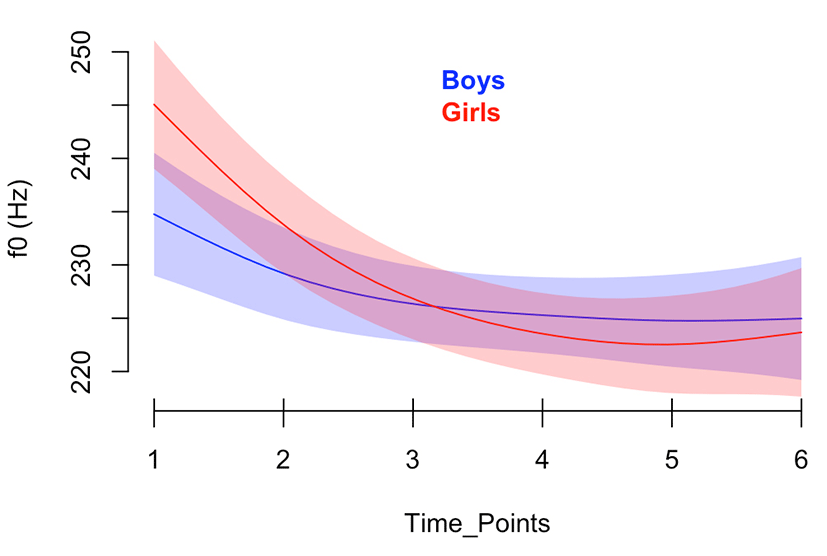
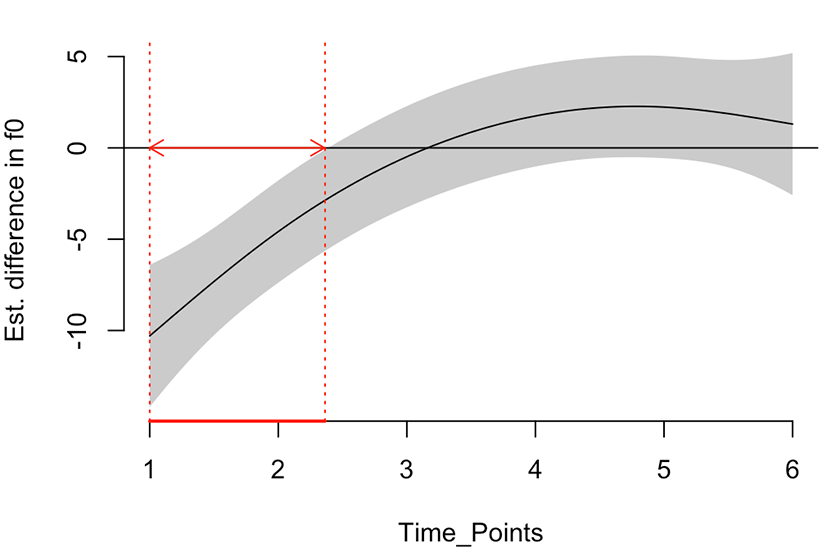
The difference smooth plot between the two groups in Figure 7 shows that these groups are significantly different at the first two measurement points within an arrow but not the third time point to the sixth time point (see Sóskuthy, 2017 for the interpretation). The girls had a pitch onset that was higher than that of the boys. The girls might have raised pitch at the beginning of their productions to make it a clearer speech. Further studies would be desirable to determine whether this result is related to any sexual or sociolinguistic characteristics.
The statistical method we used here may be applicable for comparing the stress patterns of English words or the pitch contour variation of non-native learners of a language. For example, Jung & Rhee (2018) examined the English lexical stress of international speakers acoustically in terms of duration, pitch, and intensity. They found that the pitch and intensity ratios of stressed and unstressed syllables were not significantly different when comparing native and nonnative groups but that the duration ratio was significant factor in the comparison. Instead of pitch measurements at the peaks of the stressed and unstressed syllables, the curvilinear trajectories of the target words might reveal a subtle difference. A comparison of wider pitch variations, such as accentual phrase pitch pattern or intonational phrase boundary tone, as described in Yune (2013), may also be interesting. Instead of comparing the pitch difference between and within sentences or prosodic phrases, as in the previous study, the curvilinear variation across phrases or whole sentences may be used to find a detailed portion of significant difference.
There are further issues in the statistical interpretation of the GAMMs and the acoustical scale used here. The significance testing on the curvilinear contour may be much trickier because of the potential complexity of smooth interactions and constraints on the software packages (Sóskuthy, 2017). Furthermore, the transformation of acoustical values into semitone or other auditory scales may shed light on a perceptual aspect of pitch trajectories. The semitone itself has a room for improvement. Thus, caution is needed in the application of the method.
4. Summary and Conclusion
This study examined the pitch variation of 139 American English speakers and conducted a statistical analysis of the differences in the trajectories using the Generalized Additive Mixed Models. The sound data of Hillenbrand et al. (1995) were used to collect six pitch values at the corresponding time points within each vowel segment. Some corrections to obvious errors were made manually by observing the harmonics in the narrow band spectrogram and measuring the duration of each vocal fold pulse. The results showed that the men had the lowest pitch followed by the women, boys, and girls. The standard deviations were highest for the boys and lowest for the men. The pitch values at six time points changed gradually across the time points from 204 to 193 to 196 Hz; the contour was shaped like a single dip, which might be related to the intonation pattern of reading a list of English words. From the vowel comparison, the vowel uw had the highest pitch mean while the vowel ae had the lowest one; the range was approximately 10 Hz. Because normality tests on the pitch data rejected the null hypothesis, nonparametric tests were conducted to obtain a significant difference in the values of the four groups. The GAMMs statistics had a significant result for the pitch values at the six time points but not between the groups of boys and girls. Thus, the curvilinear test was conducted and the two groups were found to be significantly different only at the first and second time points.
This study may be applicable to future studies that compare curvilinear data sets elicited from various methods. For example, subtle changes in the pitch trajectories of people in one dialectal region may be compared statistically with those of other regions or changes over time. Additionally, a comparison of the pitch data of native and non-native speakers may lead to interesting findings and applications, such as the establishment of better teaching plans or practices.


