


1. Introduction
Dysarthria is a group of speech disorders affecting motor speech production. Damage can include issues with respiration, phonation, resonance, prosody and articulation. Furthermore, depending on the severity and the type of neurological damage, individuals with dysarthria may display different speech difficulties. Therefore, it is important to conduct research on how dysarthric speech is affected by specific neuromotor disorders. The current study examines the acoustic characteristics of fricatives in patients with cerebral palsy based dysarthria in comparison to healthy controls.
Early acoustic studies on dysarthric speech have looked at a variety of acoustic cues such as vowel formants, voice onset time (VOT), voicing, fundamental frequency, prosody, and more. In most cases dysarthric speakers have impaired control over these features and will have irregular measurement. For example, a common acoustic analysis on dysarthric speech involves vowel measurements as vowels tend to be a very salient cue of impaired speech. The vowel space of dysarthric speakers can be overly large which leads to excessive overlap between vowels as discovered by Rudzicz (2010) in speakers with amyotrophic lateral sclerosis (ALS). On the contrary, those speakers may have a reduced vowel space where all vowels have similar F1 and F2 values (Kim et al., 2011; Liu et al., 2005). Severity also plays an important role in vowel space as individuals with severe dysarthria tend to have a smaller vowel space compared to milder cases.
Morris (1989) studied VOT measurements from dysarthric speech stemming from four different types of dysarthria (spastic, flaccid, ataxic, hypokinetic), and found that in general VOT values are similar to healthy speakers when considering place of articulation. Bilabials had the shortest VOT followed by coronals, and velars with the longest VOT. However, variance was significantly high, for example the VOT values of /k/ for ataxic dysarthria ranged from 30–105 ms. Similarly, it was shown that individuals with hypokinetic dysarthria had very reduced VOT measurements (i.e., /p/: 20–40 ms, /t/: 30–50 ms, /k/: 45–65 ms). These studies show that it is important to consider dysarthria type and severity when conducting acoustic studies of dysarthric speech.
While there has been lots of research looking at articulation issues with different consonants, there has been less research specifically looking at specific place or manner of articulation. A deeper acoustic analysis of fricatives may be beneficial given that previous research has shown fricatives to be the most mispronounced consonant class along with liquids and affricates (Antolík & Fougeron, 2013; Kim et al., 2010). In both these studies it was found that dysarthric speakers often pronounced fricatives as stops or would have voicing in voiceless fricatives.
One of the earliest studies specifically looking at fricatives was by Tjaden & Turner (1997) who looked at four spectral moments (mean spectral peak, variance, skewness, kurtosis) of /s/ and /∫/ from dysarthric speakers with ALS. They found that only the first spectral moment showed any significant difference between groups. Specifically, they found the mean peak was lower in ALS females for /s/ but higher measurements for /∫/. Males with ALS also showed higher mean peaks for /∫/ but no significant difference for /s/. A similar study by Chen & Stevens (2001) looked at several acoustic measurements and perceptual ratings of the fricative /s/ by dysarthric speakers. They found that the best correlation for intelligibility and perceptual rating was variance in noise amplitude and the spectrum shape of the fricative.
A more recent study on fricatives also focused on sibilants /s, ∫/ such as Kim (2017) which found that the duration and intensity of fricatives from dysarthric speakers with Parkinson’s disease are significantly different than healthy speakers. More varied results were found in spectral moment measurements. For example, more significant effects for mean spectral peak for females, but similar significant effects for both male and females for kurtosis. Fricative measurements of Korean speakers were also examined in Yang et al. (2018)’s study which found several significant effects between alveolar fricatives of children with articulation disorders and healthy controls. They found that central moment, and skewness were significantly higher in children with articulatory impairments compared to healthy children. Furthermore, mean spectral peak was significantly higher in healthy children, however, /s*/ was significantly higher in healthy children while /s/ was higher in children with articulatory impairments. Finally, variance measurements showed that /s/ is significantly higher in speech impaired children, and /s*/ is significantly higher in healthy children.
Currently no study has individually examined the spectral differences between other English fricatives (i.e., palatal-alveolar /∫/, labio-dental /f, v/, dental /ð/) in dysarthric speakers. Similarly, the previously mentioned studies only looked at mild to moderate cases of dysarthria. The current study explores a variety of word-initial fricatives coming from dysarthric speakers with cerebral palsy ranging from low intelligibility to high intelligibility. The purpose of our study is to examine how different fricatives are affected by varying levels of dysarthria.
2. Methods
Collecting speech from dysarthric individuals is time-consuming and difficult, therefore we decided to look at previously collected databases. This unfortunately means less control over word choice and phonetic environment, but consistency was maintained where possible. We only chose fricatives that were word-initial, and excluded any constant clusters such as /sp, fr/.
The data we used comes from the UA-Speech database provided by the university of Illinois. This database contains recordings of around 460 unique words from English dysarthric speakers with varying degrees of severity along with healthy controls. More information about the database or recording environment can be found in Kim et al. (2008). This study looked at 19 speakers, 10 with dysarthria and 9 healthy controls. Table 1 shows intelligibility ratings based by average score ratings of transcriptions from 5 native speakers. Two words were selected for each of the following fricatives /f, v, s, z, ∫, ð/ (12 words in total). All the English fricatives except the voiced palato-alveolar fricative /ʒ/, glottal fricative /h/ and voiceless dental fricative /θ/ was included. It would have been ideal to have all words contained in the same environment CVC with the same vowels, however, limitations of words in the database required us to use non-ideal words.
| Dysarthric speakers | ||
|---|---|---|
| Low | Mid | High |
| M01: 15% | M05: 58% | M08: 93% |
| M07: 28% | M11: 62% | M09: 86% |
| M12: 7.4% | M10: 93% | |
| M16: 43% | M14: 90.4% | |
Using Praat (Boersma & Weenink, 2019), the duration and the three spectral moments - mean spectral peak, variance and skewness -of each fricative were measured. While there is no standard method of measuring fricatives such as formants for vowels, spectral moments are commonly used in acoustic studies on fricatives (Jongman et al., 2000; Yoon, 2018). The mean spectral peak refers to the frequency which divides the spectrum in a way that the top-half frequencies are equal to the low-half frequencies. Therefore, fricatives with higher frequency energy such as sibilants should have higher means. Variance will tell us whether most energy is concentrated in a small band or dispersed over a wide range of frequencies. Finally, skewness will measure the shape of the spectrum below the mean peak compared to the frequencies above the mean peak.
The measurements we chose for this study were based on Jongman et al. (2000)’s study on English Fricatives. They found that mean spectral peak, variance and skewness were some of the most important acoustic cues for distinguishing between sibilants and non-sibilants. In their study, mean spectral peak was also able to distinguish between all 4 places of articulation. For our study, the spectral moments were measured in a 20 msec hamming window at the centre of the fricative. Using the measurements, we conducted statistical analyses to analyze any significant results.
We first looked at the results by combining average score for all dysarthric speakers, then look at the results when splitting dysarthric speakers by low intelligibility and high intelligibility. We conducted several statistical tests for analysing significant effects. For between subject effects we used a two-way mixed ANOVA where speaker group (healthy or dysarthria) along with fricative type are the independent variables and the fricative measurement (duration, spectral moments) are the dependent variables. We also conducted a repeated measures ANOVA with a Bonferroni multiple comparison for each speaker group to examine any significant effects within the different fricatives.
3. Results: All Speakers
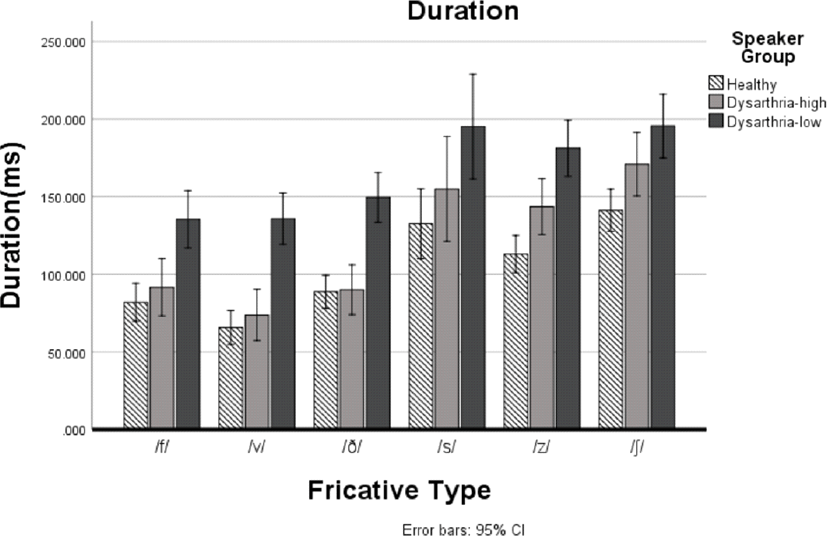
Unlike dysarthria from Parkinson’s disease, individuals with cerebral palsy tend to have a slower speaking rate which leads to longer phoneme duration. Figure 1 displays average duration of fricatives between all words and speakers. A two-way mixed ANOVA test was conducted, and test results revealed significant main effects for fricative type [F(5,370)=51.093, p<0.05]. This effect tells us that regardless of the speaker group, duration of fricatives significantly differed. Bonferonni corrected post hoc test results can be seen in Table 2 and show which specific pairs display significance. Furthermore, there was a significant main effect of speaker group [F(1, 74)=42.079, p<0.05], which tells us that dysarthric speakers have significantly longer fricative duration than healthy speakers (Table 2).
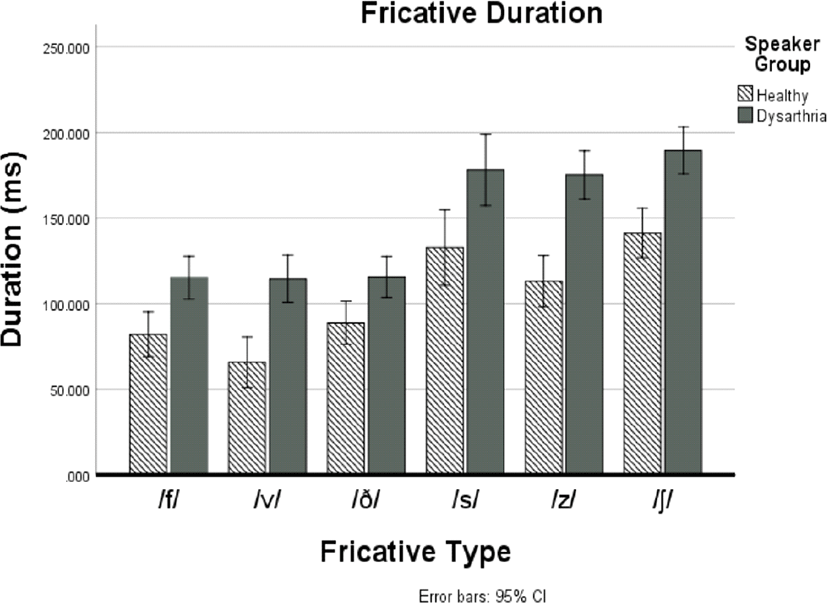
However, there was no significant interaction effect between fricative type and speaker group [F(4.127, 305.365)=1.88, p>0.05]. Therefore, differences in fricative type duration were not significant between dysarthric and healthy speakers. This means dysarthric speakers still retain duration differences that healthy speakers hold. For example, sibilants are longer than non-sibilants regardless of speaker group.
As seen from Table 3, results also show that unlike healthy speakers, dysarthric speakers show less durational differences when considering voicing pairs. Healthy speakers have longer duration for voiceless fricatives /f, s/ compared to their voiced counterparts /v, z/ but dysarthric speakers show very little difference. A repeated measures ANOVA test was conducted with fricative type as an independent variable and duration as the dependent variable. Results showed no significant difference for either voicing pairs in dysarthric speakers. Healthy speakers showed significant difference in /s, z/ pairs (p<0.005) but no significant difference for the labial fricatives (p=0.08). Given that standard deviations are quite high for dysarthric speakers, the lack of statistical significance for voicing pairs is more likely to affect speakers with low intelligibility.
| Speakers | /f/ | /v/ | /s/ | /z/ |
|---|---|---|---|---|
| Dysarthria | 115.16 (47.12) | 114.48 (55.74) | 178.19 (86.25) | 175.18 (55.44) |
| Healthy | 82.05 (28.73) | 65.72 (25.19) | 132.66(30.7) | 113.03 (28.98) |
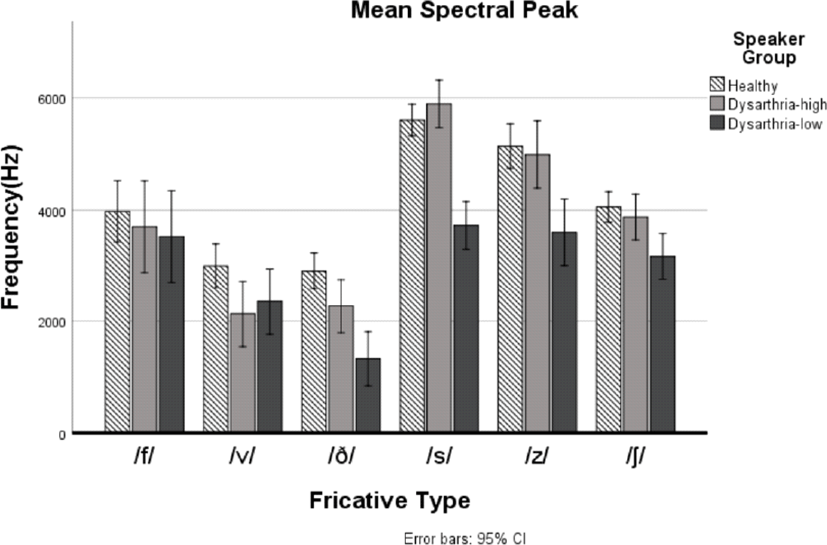
Jongman et al. (2000)’s study on fricatives found that mean spectral peak was a major cue to distinguish fricatives by place of articulation. A two-way mixed ANOVA was conducted to examine any significant effects of this spectral measurement. Similar to duration, a significant effect for fricative type [F(5,370)=57.829, p<0.05] was present showing significant difference in mean spectral peak for different fricative types for both speaker groups. Bonferroni post hoc test reveal that this was significant for all pairs except the following: /s/ and /∫/, /v/ and /ð/, /s/ and /z/. Results also show that mean spectral peak is significantly lower in dysarthric speakers [F(1,74)=6.095, p<0.05], probably because they pronounce fricatives with less narrowing, resulting in slightly longer front cavity, compared to healthy controls.
Figure 2 shows average scores for all speakers and words. As seen from the graph, while dysarthric speakers have a general lower mean peak, they still follow the trends of healthy speakers. No significant interaction effect between fricative type and speaker group [F(3.939, 291.523)=1.210, p>0.05]. Sibilants tend to have higher mean peak than non-sibilants, also voiceless fricatives tend to have higher peaks than voiced pairs for both healthy and dysarthric speakers.
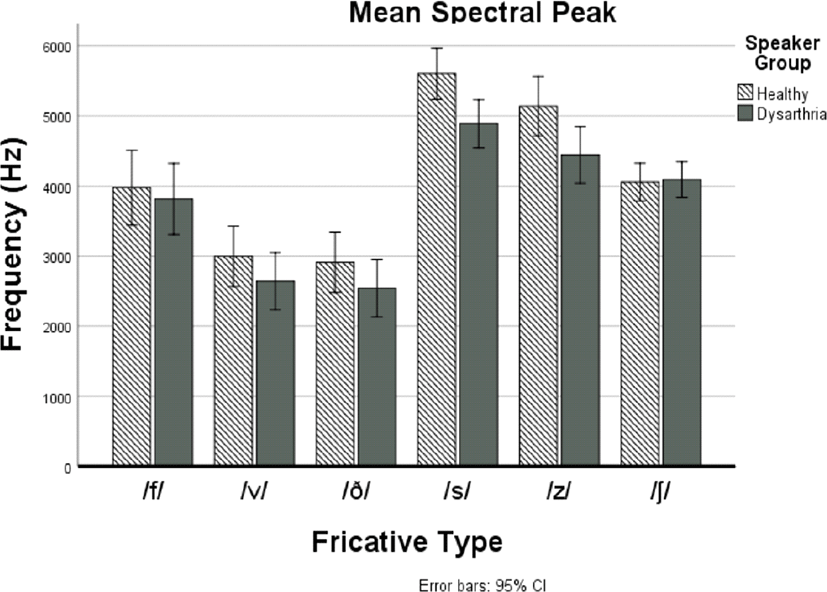
It is also useful to see whether the mean spectral peak helps to distinguish fricatives by voice or place of articulation in dysarthric speakers. Therefore, we conducted a repeated measures ANOVA with a Greenhouse-Geisser correction for all fricatives. Results show that there was a statistically significant difference between fricatives [F(3.691, 143.941)=20.779, p<0.05].
A Bonferroni pairwise comparison test revealed significant differences for most pairs in dysarthric speakers. Table 4 shows that mean spectral peak can still be used to distinguish by some place of articulations.
The same ANOVA test on healthy speakers also showed significant effects between fricatives [F(3.147, 110.145)=47.841, p<0.05]. A post hoc Bonferroni multiple comparisons showed significant effects (p<0.05) for all fricative pairs except for /f/ and /∫/ along with /v/ and /ð/. Results for healthy speaker follow similarly to Jongman et al. (2000)’s findings which found significant results for all pairs with the exception of labial and dental fricative pairs.
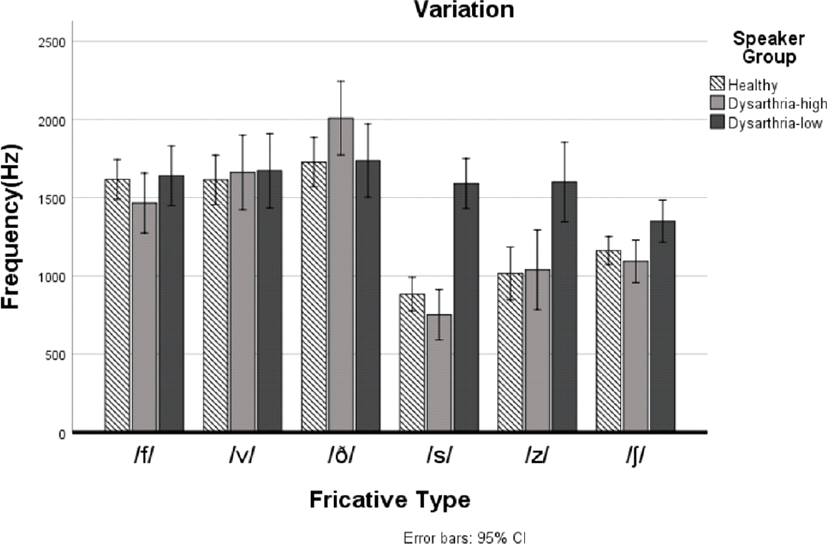
A two-way mixed ANOVA analysis also revealed significant effects for fricative type [F(5,370)=47.453, p<0.05] when looking at variance. A Bonferroni post hoc analysis show that this was significant (p<0.05) for most fricative pairs when comparing sibilants to non-sibilants. Variance was also significantly different between groups [F(1, 74)=10.941, p=0.001]. This difference can be seen in Figure 3 where dysarthric speakers generally have higher variance and more noticeably in the coronal sibilants. Despite significant group differences there are no significant interaction effects between fricative type and speaker group [F(4.129, 305.581)=1.696, p>0.05]. Both groups have lower variance in sibilant fricatives.
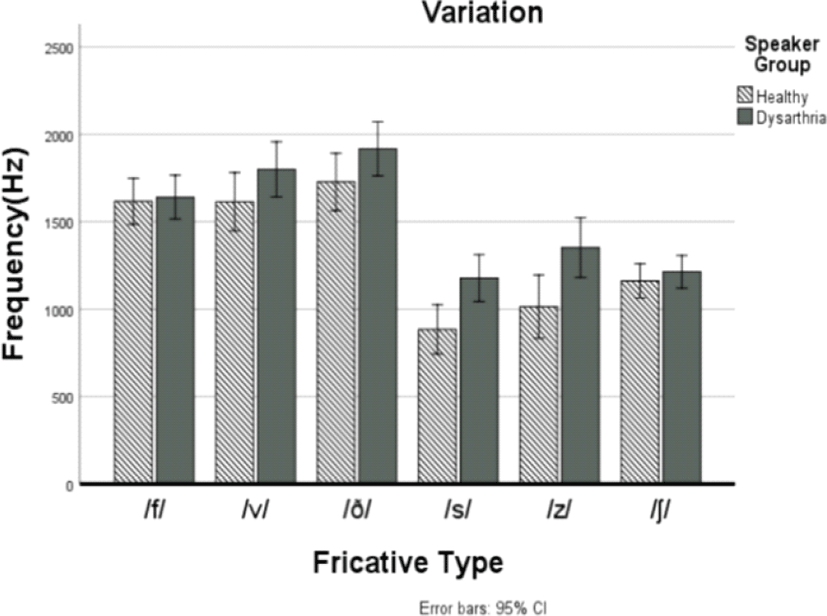
A repeated measures ANOVA show that dysarthric speakers still have significant effects for fricative type [F(5,195)=17.581, p<0.05]. However, Bonferroni multiple comparisons show fewer effects for labial/dental and coronal/palato-alveolar pairs as seen from Table 5. Results suggest that while some fricative pairs can be distinguished by place of articulation, voicing pairs are not easily distinguished.
Healthy speakers also had significant effects for place of articulation [F(3.02, 105.538)=38.076, p<0.05]. Bonferroni comparisons showed similar significant effects as dysarthric speakers with the exception that /s/ and /∫/ is also significantly different.
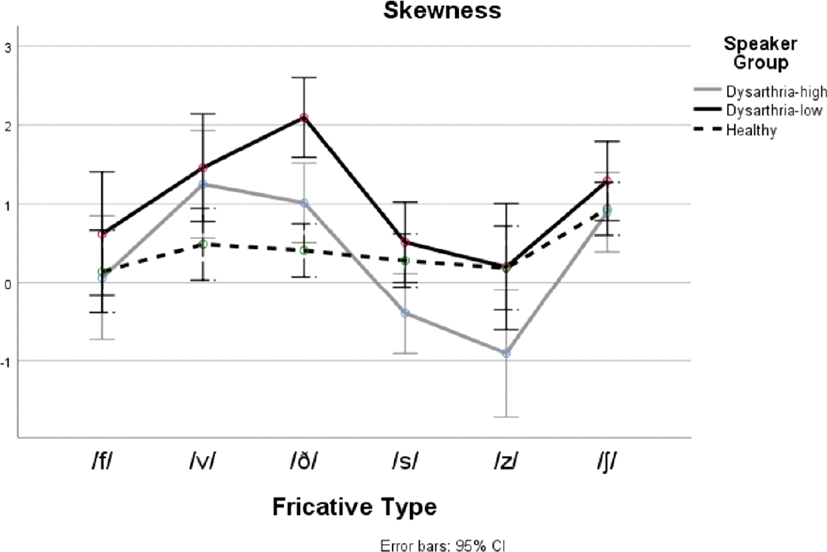
Lastly, a two-way mixed ANOVA revealed a significant effect for skewness and fricative type [F(4.387, 324.674)=7.638, p<0.05]. Therefore, regardless of speaker group, skewness measurements significantly differed between the different fricatives. Also, unlike the previous measurements, a significant interaction effect was seen in fricative type and speaker group [F(4.387, 324.674)=2.710, p<0.05]. This means dysarthric speakers had skewness values which do not follow the measurements of healthy speakers when taking into consideration of fricative type. For example, healthy speakers have similar values for labial and coronal while dysarthric speakers have a much larger difference between those fricatives.
Interestingly, skewness showed significant differences between groups [F(1, 74)=27.805, p>0.05]. Figure 4 shows mean skewness scores for both dysarthric and healthy groups. While skewness had no overall significant effect between groups, there were some significant effect when looking at Bonferroni multiple comparisons. For example, there were significant between-group effects (p<0.05) for the following pairs; /f, v/, /v, s/, /v, z/, /ð, z/, /s, ∫/ and /z, ∫/.
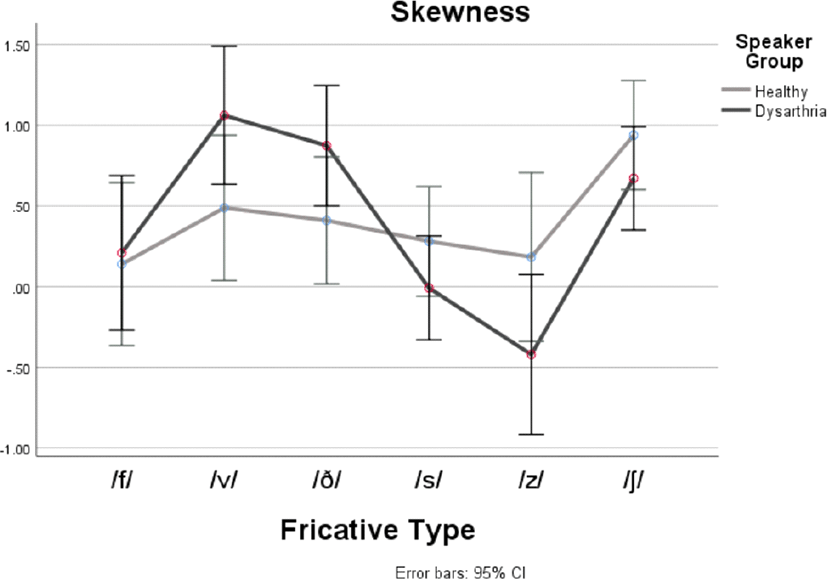
Again, dysarthric speakers displayed significant within-subject effects [F(5, 195)=6.741, p<0.05]. However, multiple comparisons show that this was only significant for few pairs as seen in Table 6.
Healthy speakers also showed significant effect for fricative type [F(5, 175)=2.996, p<0.05], but Bonferroni multiple comparisons show that this was only significant for /f/ and /∫/ along with /s/ and /∫/.
4. Results: Intelligibility Consideration
Results with all dysarthric speakers show that duration and spectral moments show significant effects when compared to healthy speakers. However, considering the severity of dysarthria and how this affects acoustic measures of fricatives is important. As seen in Figure 5, fricative duration increases as intelligibility level decreases, displaying a correlational relationship (r=.744, n=19, p<0.05) and significant group effect [F(2,65)=32.99, p<0.05]. Furthermore, even highly intelligible dysarthric speakers have significantly longer fricatives than healthy speakers [F(1,50)= 14.203, p<0.05]. Pairwise comparisons show that this is more significant for the sibilant fricatives.
Spectral moments showed varied results. For example, mean spectral peak in highly intelligible dysarthric speakers and healthy speakers showed significant group effects (p<0.05) whereas skewness and variance did not. However significant group effects were seen when comparing all three speaker groups (p<0.05) for all spectral moments. This implies that even dysarthric speakers have significantly different measurements when taking severity into account. As can be seen in Figure 6, 7, and 8, highly intelligible speakers tend to have values that fall between healthy speaker and low intelligible speakers.
5. Discussion and Conclusion
Results show that the acoustic cues in fricatives produced by dysarthric speakers show some significant differences when compared to healthy speakers. Also, different significant effects can be seen when comparing different levels of intelligibility.
Firstly, as expected, duration of fricatives is longer in dysarthric speakers. This also extends to dysarthric speakers who are highly intelligible.
Spectral moments also showed very interesting effects on dysarthric speakers. Mean spectral peak had significant effects between speaker groups and was still able to distinguish between most places of articulation and in dysarthric speakers. In general, mean spectral peak was lower for dysarthric speakers for all fricatives, which is inconsistent with Tjaden & Turner (1997)’s findings which saw higher peaks in dysarthric speakers for /∫/ and no difference for /s/. Our finding also contradicts Kim (2017)’s results which showed no significant group effects for mean spectral peak.
Various reason may explain why these differences were apparent.
Firstly, the previous studies looked at dysarthric with ALS and Parkinson’s respectively. Therefore, it could simply be the case that individuals with cerebral palsy display unique articulatory difficulties with fricatives. This would support Antolík & Fougeron (2013)’s finding that fricative distortions are more diverse in dysarthric speakers with cerebral ataxia compared to Parkinson’s and ALS speakers. Another possible explanation is that we averaged scores of all speakers not just ones with mild to moderate dysarthria. However, we also conducted a statistical analysis on the fricatives of highly intelligible dysarthria and still found mean spectral peak to have a significant group effect.
Chen & Stevens (2001) study found that even highly intelligible speakers with dysarthria had deviations in spectral tilt for /s/. They hypothesized that impaired motor control of the tongue blade was a likely factor. Given that the dysarthric speakers we analysed also had impaired motor control of their articulators, it is possible that participants were unable to position their tongue and other articulators to produce high frequency energy. This could lead to an overall lower mean spectral peak.
Variance also had a significant effect between groups and was still able to distinguish between some places of articulation for dysarthric speakers. Our measurements also follow Jongman et al. (2000)’s finding that sibilants have less variance than non-sibilant fricatives. However, this distinction was much less visible for dysarthric speakers with low intelligibility. Lastly, skewness measurements revealed several findings. While there were no overall significant group effects, significant effects were seen when looking at individual fricative pairs. Our findings also support Jongman’s finding that /∫/ has a more positive skewness than /s/ and a higher skewness overall.
These results are promising in showing that the acoustics of fricatives can be used to identify dysarthric speakers. Duration along with mean spectral peak and variance all showed significant group effects even with highly intelligible dysarthric speakers. Traditional diagnosis for dysarthria requires the subjective analysis of a trained speech pathologist, which can be costly and time consuming. Future research should investigate whether the acoustic properties of fricatives can be used as features for automatic classification. An automatic method of diagnostics can aid speech pathologists in their assessments and provide a more objective analysis.
It would also be worth examining which specific fricatives are commonly misarticulated and how they are perceived by native listeners. A follow-up perception test to see how listeners perceive different fricatives from dysarthric speakers can provide more insight into how human listeners perceive impaired speech.
In conclusion, this study showed how acoustic measurements of several fricatives can differ in dysarthric speakers but still be a cue in discriminating different places of articulation.