1. Introduction
Consonants are fundamental components of spoken language, and classifying their inventories across the world’s languages requires consideration of multiple phonetic and phonological features. According to articulatory phonetics, consonants are categorized by their place and manner of articulation, vocal fold vibration, and secondary articulatory features (Ladefoged, 2001; Ladefoged & Maddieson, 1996; MacKay, 2023). Common places of articulation include bilabial (/p, b, m/), alveolar (/t, d, n, s/), and velar (/k, g, ŋ/). Manner of articulation refers to how airflow is modified: stops are produced by complete closure of the vocal tract (/p, b, t, d, k, g/), whereas fricatives involve turbulent airflow caused by a narrow constriction (/f, h, s, z/). Some languages also classify consonants according to vocal fold activity, distinguishing between voiceless and voiced segments (/p, b/) or phonation types such as breathy (/ɦ/) and creaky (/b̰/). Consonants may further exhibit secondary articulations, such as labialization (/kw/) or palatalization (/tj/), with labialization typically indicated by a superscript /ʷ/ denoting lip rounding immediately following the consonant.
Research on consonant inventories provides crucial insights into phonetic diversity and linguistic typology. Such studies uncover cross-linguistic patterns of phoneme distribution, commonalities in phonological organization, and cognitive mechanisms underlying speech perception and communication. Previous work has documented substantial variation: Maddieson (2013) reported consonant inventory sizes ranging from as few as six phonemes (/p, b, t, d, k, g/ in Rotokas, Papua New Guinea) to as many as 122 in !Xóõ (Khoisan, Botswana), with a median of 21 across 562 languages.
To explain these structural patterns, Nikolaev & Grossman (2020) tested the feature-economy principle using data from 2,761 languages in the PHOIBLE database (Moran & McCloy, 2019). While the principle accounted for many regularities, certain consonant classes and peripheral clusters followed additional organizing principles. They concluded that feature economy must be supplemented by other explanatory frameworks. Building on earlier proposals, Lindblom & Maddieson (1988) argued that smaller inventories favor unmarked features, while larger ones incorporate more marked sounds. Greenberg (1975) introduced the notion of a graded hierarchy of markedness, emphasizing that phonological features fall on a continuum rather than a strict marked-unmarked dichotomy. Similarly, Clements (2003) proposed that phonological systems maximize contrasts by balancing the number of sounds against the number of features employed.
Recent research has also addressed methodological challenges. Anderson et al. (2023) compared nine datasets of published phoneme inventories, applying the Cross-Linguistic Transcription Systems (CLTS) to standardize transcription. They demonstrated that discrepancies in phonemic criteria and transcription conventions can distort cross-linguistic comparisons, as even datasets within PHOIBLE report substantially different inventory sizes despite similar language coverage. Moran (2012) likewise noted inconsistencies in transcription practices and applied statistical association measures to vowel distributions using multidimensional scaling (MDS). Yang (2024) further highlighted coding inconsistencies within PHOIBLE and selected the ph source covering 913 languages compiled from journal articles, theses, and grammars to ensure more reliable phonemic data. His work on vowels showed that a small set of primary vowels (/a, i, u/) accounted for a disproportionately large share of occurrences, suggesting systematic asymmetries in phoneme distributions.
Despite the central role of consonants in linguistic systems, relatively few studies have examined their cross-linguistic patterns in detail. The present study seeks to fill this gap by analyzing consonant inventories in 913 languages using the PHOIBLE database. Specifically, it (1) examines the frequency distributions of consonants, visualizing normalized values on the IPA chart (International Phonetic Association, 2025), and (2) analyzes statistical associations among consonant segments through multidimensional scaling based on pointwise mutual information. These findings aim to provide a deeper understanding of consonant inventory structures and broader insights into the typology of the world’s languages.
2. Method
PHOIBLE is a comprehensive repository of phonetic and phonological data from the world’s languages (Moran & McCloy, 2019). It contains 3,020 phoneme inventories, comprising 3,183 distinct segment types from 2,186 languages. The database is freely accessible, allowing researchers to browse and download inventories to analyze cross-linguistic phonological patterns.
Phoneme inventories from the PHOIBLE database were downloaded and saved as a source dataset using an R script (v.4.4.1, R Core Team, 2024):
url_ <-
"https://github.com/phoible/dev/blob/master/data/phoible.csv?raw=true"
col_types <- cols(InventoryID='i', Marginal='l', .default='c')
phoible <- read_csv(url(url_), col_types=col_types)
write_csv(phoible, "phoibledataset.txt")
The original database contained 105,484 phoneme tokens. Building on Yang (2024), who analyzed vowel inventories from the same source, the present study focused on consonant patterns. Since the database lists different vowel sets for Korean depending on the source, we selected the ph source to ensure consistency.
From the 913 languages included, the dataset contained 24,365 consonant tokens. After applying the same rigorous filtering method as Yang (2024), 165 duplicates (consonants listed multiple times within the same language inventory) were removed, yielding a final dataset of 24,200 consonants. Accuracy was further checked using an Excel function to detect identical values in adjacent cells after sorting by language.
Subsequently, distance matrices were calculated using a symmetric pointwise mutual information (PMI) method applied to the filtered consonant inventories. MDS plots were then generated in two dimensions (following Yang, 2024), with normalized frequency represented by circle size for clearer visualization.
3. Results and Discussion
This study analyzed 24,200 phoneme tokens from the ph source, representing 1,157 distinct consonant types across 913 languages. Of these, 263 consonants lacked diacritics, while 894 included one or more. Primary consonants without diacritics accounted for 18,254 occurrences, whereas diacritic-marked consonants accounted for 5,946. Although diacritic-free consonants constitute only 22.7% of the distinct types, they represent 75.4% of the total tokens, underscoring the dominance of primary articulations. Yang (2024) reported a similar trend in vowels, where 30% of the primary vowel types without diacritics represented 64% of total vowel occurrences.
The dataset also included consonant clusters: 21,467 single consonants, 2,500 double clusters, 152 triple clusters, 80 quadruple clusters, and a single five-consonant cluster (/ŋmkpɾ/) found in Mbembe. Single consonants made up 88.7% of the dataset, indicating that clustering is relatively rare and warrants further study.
Table 1 ranks the 20 most frequent consonants with percentage values based on data from 913 languages.
The most common phoneme, /m/, occurs in 902 of the 913 languages (98.8%). The next most frequent, /k/, appears in 861 languages, followed by /n/ and /j/, both present in over 91% of the languages. Voicing pairs such as /p-b/, /t-d/, and /k-g/ also rank highly, occurring in more than 68% of the languages. Among the top 20 consonants, eight are voiceless and twelve are voiced. Notably, the 18th-ranked phoneme /t̠ʃ/ is a postalveolar affricate formed by a retracted /t/, making it acoustically closer to a fricative. Maddieson (1984) observed that at least 80% of languages contained /p, t, k, m, n, s, j/, with /k/ particularly common. In the present study, six of these exceeded the 80% threshold, with /t/ slightly lower (78.6%). Additionally, /l/ and /w/ surpassed 80%, reflecting differences in sampling and transcription practices (Anderson et al., 2023).
Figure 1 visualizes these distributions on an IPA chart of 59 consonants, where circle size represents normalized frequency. The horizontal axis represents place of articulation and the vertical axis manner of articulation.
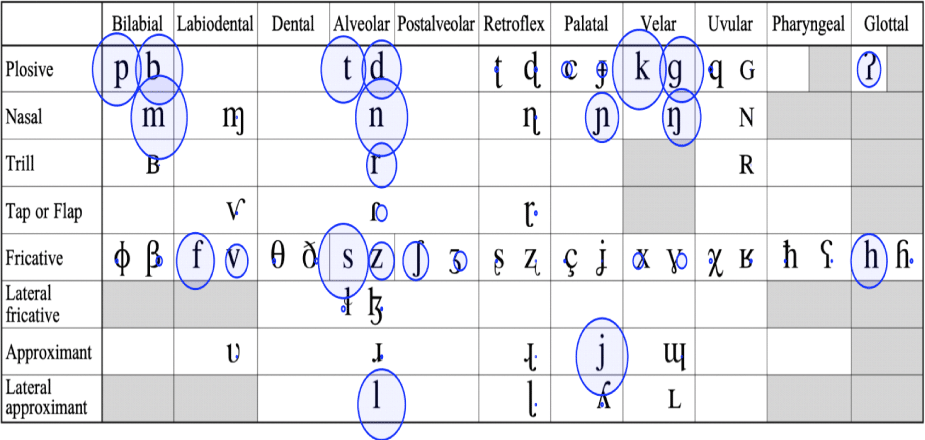
The consonantal distribution is analyzed in terms of manner, place, and voicing.
By manner, plosives, fricatives, and nasals dominate, with 5,331, 4,201, and 2,932 occurrences, respectively. Approximants (910) and lateral approximants (817) rank fourth and fifth. Within these categories, /r/, /j/, and /l/ stand out for their high frequencies. The relatively sparse distribution of approximants may be partly due to the absence of /w/ from the IPA chart, despite its occurrence in 87.1% of the languages. Affricates such as /ʧ/ and /ʤ/ are also absent as independent phonemes on the IPA chart, since they involve both stop and fricative gestures, but the ph source lists them due to their phonemic status in many languages. Parsing affricates with secondary articulations, such as /t̠ʃ/, remains a classification challenge.
By place, alveolar consonants are the most frequently occurring category (4,929), followed by bilabials (2,578), velars (2,531), and palatals (1,824). Labiodentals and glottals each occur about 1,000 times. Alveolars thus dominate, with bilabials and velars at roughly half their frequency. The observed distribution appears to reflect both articulatory simplicity and perceptual salience, consistent with quantal theory (Stevens, 1989) and Lindblom’s (1990) principle of maximizing perceptual contrast. Similar spacing effects in vowel systems reported by Yang (1996, 2021) support the view that consonant inventories are also shaped by the need to preserve adequate perceptual distinctiveness.
By voicing, the dataset contains 9,126 voiced and 5,873 voiceless consonants. Although voiced consonants predominate overall, voiceless consonants are more common among plosives and fricatives. For example, voiceless plosives total 2,361 occurrences compared to 2,089 voiced, and voiceless fricatives occur more than twice as often as voiced ones (2,408 vs. 1,010). The bilabial stop /p/ occurs in 28 more languages than /b/, reflecting the unmarked status of voiceless consonants. In contrast, all approximants, nasals, taps, and trills are voiced. Thus, the markedness of voicing differs across manner categories.
Nasals show an asymmetrical distribution: /m/ occurs in 902 languages, /n/ in 837, and /ŋ/ in 615. The lower frequency of /ŋ/ may be influenced by the presence of /ɲ/ in the palatal region, analogous to vowel spacing patterns. Palatal consonants such as /ɲ/ and /j/ are especially frequent, while the glottals /ʔ/ and /h/ occur at mid-range frequencies. These findings point to systematic asymmetries in the organization of consonant inventories. Further analysis of consonant and vowel distributions in the world’s languages, using rigorous transcription and tabulation, could help test the hypothesis of symmetrical phoneme distribution on the chart.
Figure 2 presents an MDS plot based on PMI for all the consonants in the ph source.
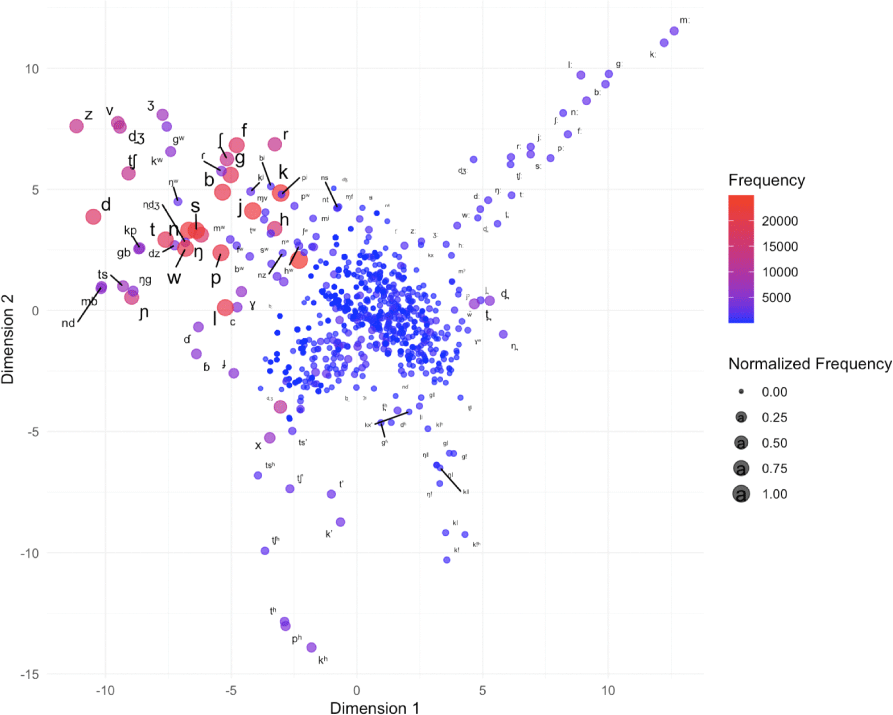
The color gradient represents frequency (red = high, blue = low), while circle size indicates normalized frequency.
In this plot, the most frequent consonants (stops, nasals, fricatives) form a dense cluster in the left-central region, represented by large red circles. In contrast, rare phonemes, consonants with diacritics, and language-specific sounds such as clicks and ejectives appear more dispersed.
The left-central cluster also includes labialized consonants (e.g., /bw, kw, gw, mw, nw, sw, ŋw/) and several consonant clusters. Moving clockwise, the upper right region contains consonants marked with lengthening diacritics, which extend toward the upper-left area. The middle-left region features a cluster of dental consonants (/d̪, l̪, n̪, t̪/), characterized by tongue-to-teeth contact and their shared alveolar articulation. On the lower left, aspirated plosives (/ph, th, kh/) and the aspirated affricate /t̠ʃh/ are grouped together, alongside ejective consonants (/tʼ, kʼ, tsʼ/). Consonants with smaller frequencies, shown as smaller circles, are scattered near the origin.
Ladefoged & Maddieson (1996) noted that ejectives and clicks are globally rare, a pattern reflected in their peripheral distribution here. Because of overlapping symbols and the density of the plot, some consonants are difficult to identify, so subsequent analyses separate consonants with and without diacritics for clarity.
Figure 3 displays an MDS plot for consonants without diacritics.
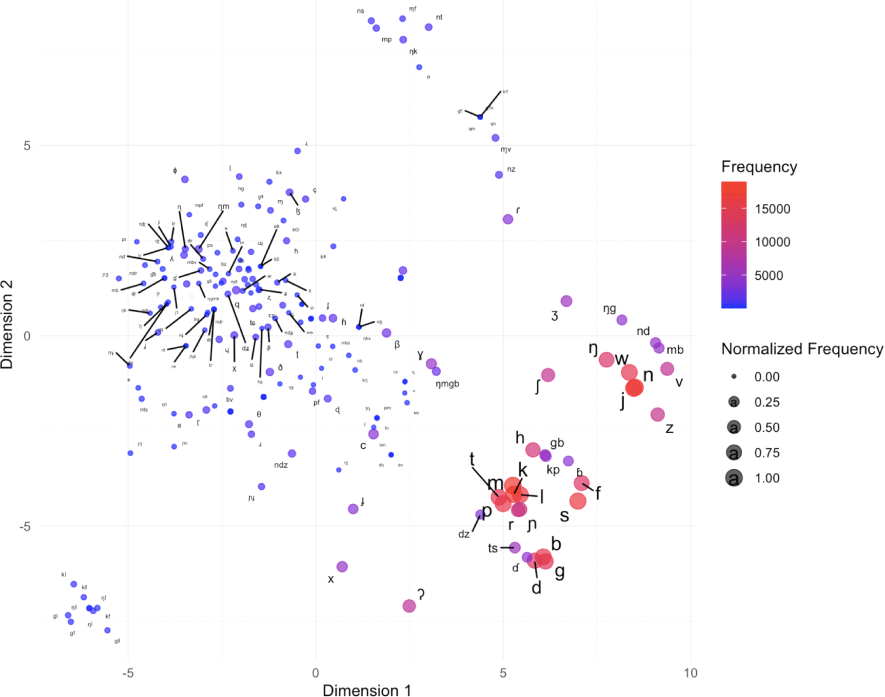
The color gradient represents frequency (red = high, blue = low), while circle size indicates normalized frequency.
The most frequent phonemes, shown in red, cluster in the lower right, reflecting their near-universal presence across languages (Maddieson, 1984). Their tight clustering suggests frequent co-occurrence and a central role in phonological systems. Less frequent consonants, shown in blue and purple, are widely scattered, indicating weak PMI associations across languages. Rare phonemes such as /ɣ, β, ʃ, ʔ, ɬ/ occur farther away from the core cluster.
Nasal-initial clusters such as /mb, nd, ŋg/ extend toward the upper center, continuing into /nz/ and /ns/. The glottal stop /ʔ/ appears near the lower center alongside /x/, reflecting their limited co-occurrence with other consonants. Voiceless stops (/p, t, k/) and their voiced counterparts (/b, d, g/) form distinct clusters, while the lateral /l/ appears unexpectedly near voiceless plosives. Postalveolar clicks (/gǃ, kǃ/) occupy the lower-left area. Larger consonant clusters (more than three consonants) are primarily centered in the left-middle region, which may have contributed to the central positioning of primary consonants.
Figure 4 presents an MDS plot for consonants with diacritics.
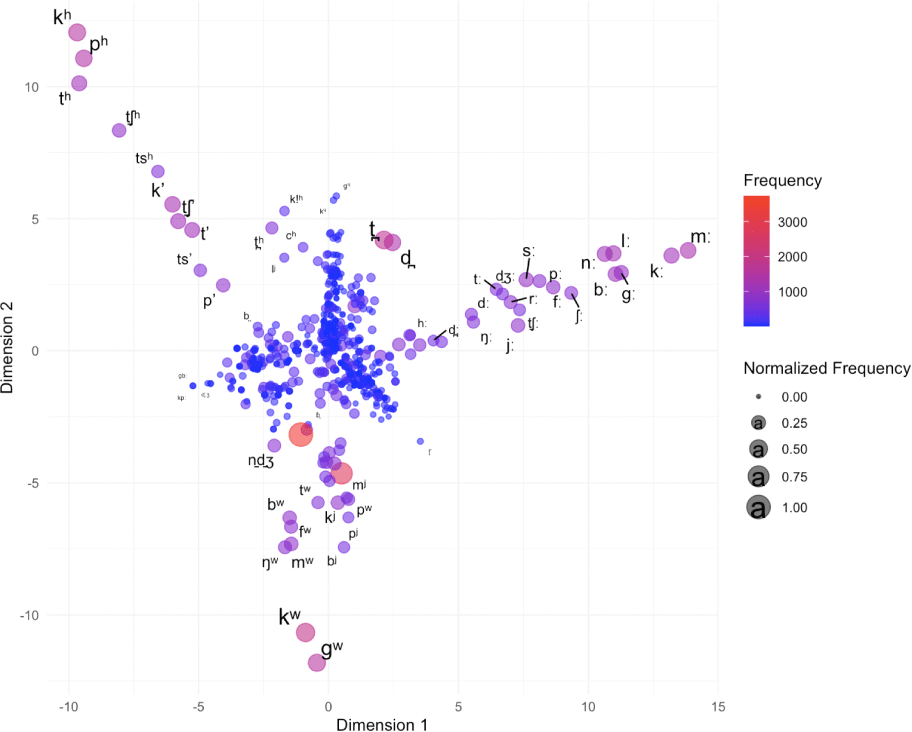
The color gradient represents frequency (red = high, blue = low), while circle size indicates normalized frequency.
Compared with Figure 3, these consonants with diacritics show greater dispersion, reflecting the articulatory complexity introduced by features such as aspiration, ejectives, and labialization. Frequent diacritic-marked phonemes cluster centrally, while rare ones are widely scattered. Labialized consonants (/kw, gw, bw, fw/) appear isolated in the lower region, often accompanied by palatalized consonants. Aspirated and ejective stops (/th, tsʼ, kʼ/) are located in the upper-left, showing that these features do not commonly co-occur across languages. Consonants with lengthening diacritics form a band from the center slightly ascending to the upper right, while aspirated vs. unaspirated contrasts form a band toward the upper left.
Nikolaev & Grossman (2020) argued that long consonants (e.g., /bː, dː, gː/) should be grouped by the layering principle rather than paired with voiceless counterparts (e.g., /bː-p/). This approach explains new classes by adding features to existing combinations. Similarly, Moran (2012) suggested that languages tend to expand inventories through lengthening or nasalization rather than diphthongization. The present analysis supports this view, as MDS successfully separates secondary articulations that were obscured in the full dataset (Figure 2). This highlights the value of tailored MDS plots for revealing associations within specific consonant categories.
Figure 5 shows an MDS plot of the 17 most frequent consonants without diacritics, including /r/, which occurs in 52.6% of the languages. Together, these consonants appear 12,203 times across at least 480 languages (see Table 1).
The color gradient represents frequency (red = high, blue = low), while circle size indicates normalized frequency.
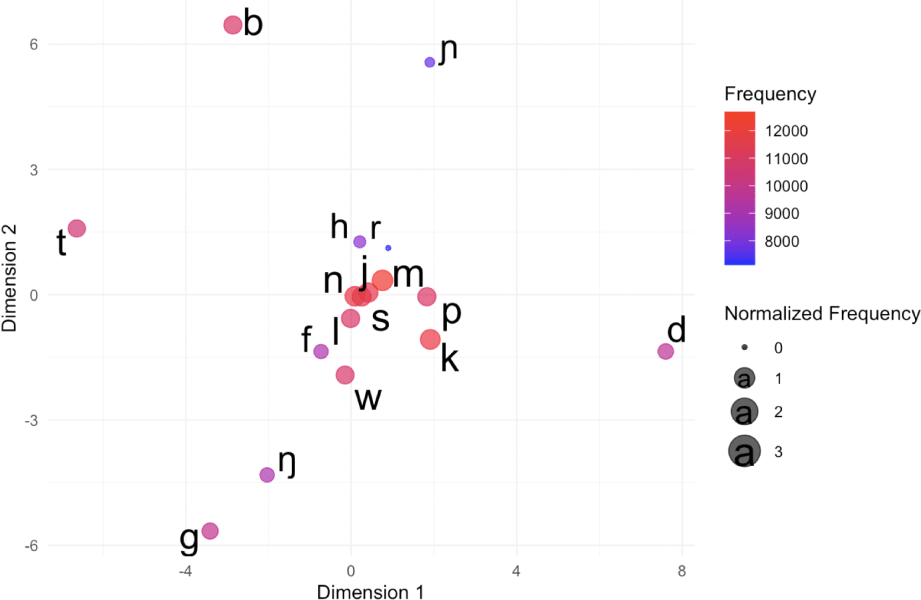
The plot reveals a central cluster of universally common consonants, while outliers represent language-specific or less frequent phonemes. The most common consonant, /m/, is located near the origin, surrounded by /j, k, l, n, p, s, w/, each found in over 83% of the languages. These sounds frequently co-occur due to their articulatory simplicity, perceptual salience, and widespread phonotactic patterns. Nasals, in particular, are nearly universal (/m, n/ occur in over 98% of languages; Maddieson, 1984). Stops and fricatives are also fundamental components of core vocabularies.
By contrast, voiced plosives (/b, d, g/) appear further from the center, reflecting more variable distribution. Some languages lack them entirely (e.g., Hawaiian lacks /b/ and /d/), whereas voiceless stops (/p, t, k/) are nearly universal. Interestingly, /t/ is positioned to the left and /k/ to the right-center, suggesting that their distributions are influenced by language-specific rules such as aspiration or positional constraints. Yang (2024) observed a similar pattern in vowel distribution, where four peripheral vowels (/ɛ, ɪ, ɔ, ʊ/) formed pairs (/e-ɛ, i-ɪ, o-ɔ, u-ʊ/) that clustered near the center, with /a/ positioned almost at the origin. These consonant and vowel distributions may have been influenced by the subset selection process. When the author conducted a statistical analysis excluding /m/, the resulting plot maintained the relative locations of the other sixteen consonants. Further research could explore the effects of removing specific consonants step by step on the statistical analyses.
Figure 6 visualizes co-occurrence associations among these 17 consonants.
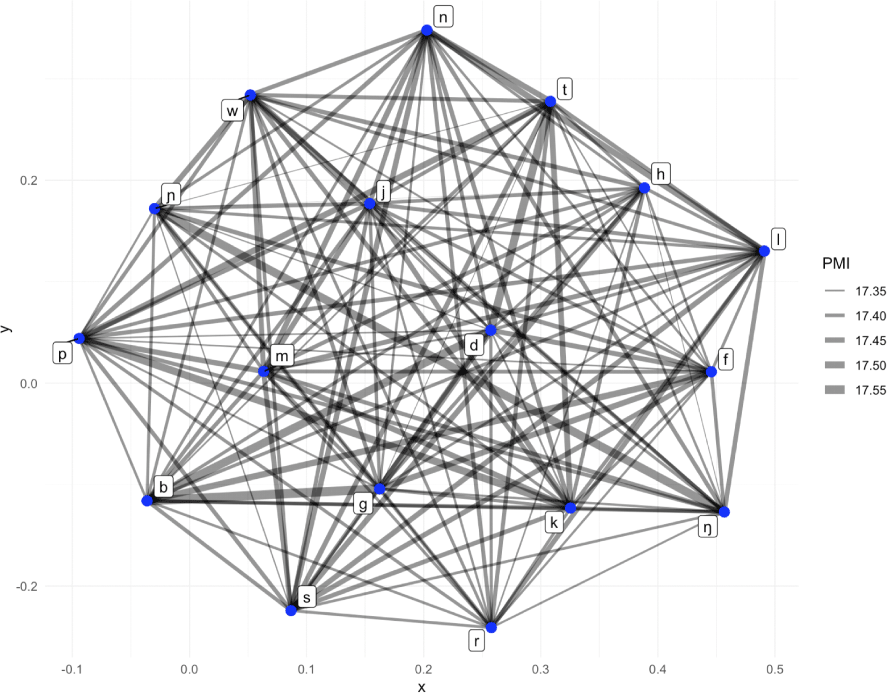
Thicker connecting lines indicate stronger PMI associations. Highly connected consonants such as /l, m, n, p, s, t/ form dense hubs, with nasals and plosives particularly central. Liquids (/l, r/) are also strongly linked, reflecting their frequent presence in languages with richer inventories. These associations appear more distinct in Figure 6 with gradient connecting lines than in Figure 5. Glides (/j, w/) and fricatives (/f, h/) are somewhat peripheral, partly because glides can function as allophones and /r/ varies widely in articulation (tap, trill, approximant). Bilabials (/p, b, m/) show moderate connectivity, suggesting that some languages lack one of these segments. These patterns indicate that consonant co-occurrence networks, much like those observed in vowels (Yang, 2024), provide valuable insights into the structural organization of phoneme inventories.
4. Summary and Conclusion
Consonants are typically classified by their place of articulation within the vocal tract, the manner in which airflow is modified, voicing, and secondary articulatory features. Cross-linguistic consonant inventories provide important insights into phonological systems and linguistic typology. This study investigated consonant systems using the PHOIBLE database, a comprehensive repository of phonetic and phonological information from numerous languages. The analysis examined both the frequency distributions and the association patterns of consonant phonemes with and without diacritics using MDS based on pointwise mutual information.
The results showed that 263 consonant types without diacritics accounted for 75.4% of the dataset, indicating a strong preference for primary articulations. Single consonants were overwhelmingly dominant (88.7%). The most frequent phonemes were the labial nasal /m/, followed by the velar stop /k/, and the alveolar nasal /n/. By manner of articulation, plosives were the most common, followed by fricatives and nasals. By place, alveolar consonants ranked highest, with bilabials and velars occurring at nearly equal rates. While voiceless consonants were often more common than their voiced counterparts, the markedness of voicing varied by manner category. MDS plots revealed clusters of related consonants, highlighting structural associations more effectively when consonants were separated into subsets with or without diacritics, rather than presented together in a crowded chart.
These findings demonstrate that large-scale phonological databases, combined with sophisticated statistical methods, can yield valuable insights into the organization of the human sound system. Nevertheless, this study has limitations, including the scope of languages analyzed, the categorization of consonants on the IPA chart, and the density of association plots. Future research should aim to refine consonant classification, improve the consistency of phonetic transcription, and expand cross-linguistic datasets in order to produce more robust and statistically reliable results.


