


1. Introduction
The ternary laryngeal contrast in Korean stops–lenis, fortis, and aspirated–is typologically rare. In domain–initial or post–pausal positions, all three series are phonetically realized as voiceless, resulting in voice onset time (VOT) distributions that cluster in the positive range. Taking the lenis series as the unmarked baseline, the Korean stop triplet involves a fortition contrast with the fortis series and an aspiration contrast with the aspirated series. Table 1 lists the phonemic transcriptions of the three series of Korean stops at three places of articulation–bilabial, alveolar, and velar. This stands in contrast to more common ternary systems, which incorporate both voicing and aspiration contrasts and can be effectively dispersed along the VOT continuum, with VOT as the sole parameter (e.g., Thai, as reported in Lisker & Abramson, 1964). In addition to its typological rarity, this ternary contrast has undergone substantial diachronic shifts in its phonetic realization over the past few decades and displays considerable dialectal variation across geographical regions. The Korean stop triplet has been extensively investigated in previous studies, with respect to articulation, acoustics, and perception. A comprehensive overview is provided in the review by Lee et al. (2020).
| Lenis | Fortis | Aspirated | |
|---|---|---|---|
| Bilabial | /p/ ㅂ | /p*/ ㅃ | /ph/ ㅍ |
| Alveolar | /t/ ㄷ | /t*/ ㄸ | /th/ ㅌ |
| Velar | /k/ ㄱ | /k*/ ㄲ | /kh/ ㅋ |
Two aspects of the Korean stop triplet merit particular attention. The first concerns the involvement of multiple phonetic cues. A one–dimensional system based solely on VOT does not adequately distinguish the three series of stops. This is attributable, first, to the substantial overlap in their VOT distributions when all three are realized as voiceless (Ito, 2017; Kang, 2014, etc.); and second, to the sub–phonemic allophonic variation in the VOT of lenis stops (i.e., intervocalic voicing), although it appears to occur in a gradient manner (see Han & Weitzman, 1970; Jun, 1994, etc.). As a result, numerous studies have sought to identify acoustic correlates beyond VOT, focusing in particular on properties of the following vowel, such as f0 and voice quality. Discussions of f0 in relation to the Korean stop contrast can be found in Han & Weitzman (1970), Hardcastle (1973), Kagaya (1974), and Kim (1965), as well as in studies addressing the possible tonogenesis in Seoul Korean, such as Bang et al. (2018), Kang (2014), and Silva (2006). Overall, the f0 of vowels following fortis and aspirated stops has consistently been found to be higher than that following lenis stops. With regard to voice quality, relevant discussions can be found in Cho et al. (2002), Ito (2017), Jang et al. (2024), and Lee & Jongman (2012), who examined a range of Korean dialects. Despite differences in regional focus, their findings consistently show that fortis stops are associated with greater laryngealization–reflected, for instance, in lower harmonic differences (e.g., H1–H2).
The second aspect concerns cue weighting in the presence of multiple phonetic cues. Given that the phonetic realization of the Korean stop triplet varies across Korean varieties both generationally and regionally, one key factor argued to influence cue weighting patterns is the absence versus presence of lexical pitch accent. Certain Korean dialects–such as Gyeongsang and Hamgyong–retain lexical pitch accent systems inherited from Middle Korean (see Ito & Kenstowicz, 2017). For speakers of these dialects, pitch is utilized for signaling lexical contrasts, meaning that the resource of f0 is primarily occupied by suprasegmental functions, thereby reducing its availability for being involved in segmental contrast (Lee & Jongman, 2012, 2018; Oh & Yang, 2013).
Although substantial achievements have been made by the existing literature of the ternary laryngeal contrast in Korean stops, most studies have relied on analyses based on a single or very limited set of parameters. Due to methodological differences across studies, it is difficult to make direct quantitative comparisons based on the reported data across different parameters and varieties. As a result, we are constrained to qualitative assessments of general trends, which poses a major obstacle to achieving a more fine–grained understanding of the Korean ternary stop contrast.
Given that traditional approaches based on simple comparisons of individual parameters cannot capture the interrelationships among multiple relevant cues, the computational processes by which machine learning models identify linguistic categories may offer valuable insights. When a classification model is capable of identifying distinct phonological categories with near–perfect accuracy, analyzing how the model draws on input parameters–such as whether a particular predictor variable is heavily relied upon, disregarded, or even misleads classification–can provide a quantitative and verifiable basis for the understanding of the contrast. An attempt in this direction was made by Lee & Jongman (2018), who employed a linear discriminant analysis (LDA) model to examine cue weighting between VOT and f0 in the production of the Korean stop triplet by speakers of Seoul Korean (non–tonal) and Gyeongsang Korean (tonal) across different age groups. By evaluating the classification accuracy of models using VOT and f0 as the predictor variable, respectively, they provided a quantitative account of both generational sound change and regional variation. Compared to earlier studies that relied primarily on pairwise comparisons and yielded only qualitative conclusions–such as suggesting that a particular cue is enhanced under certain conditions–their approach offered a more refined and compelling framework.
Inspired by this work, the present study further expands on this line of research. We introduced two supervised machine learning models: LDA, as employed by Lee & Jongman (2018), and a random forest (RF) classifier, which does not rely on linear assumptions, a non–linear method that has been adopted in several studies on phonetic category classification (e.g., Brown et al., 2014; Villarreal et al., 2020). For both models, we computed feature importance scores for each predictor to quantify their relative contributions. In addition, we adopted an unsupervised K–means clustering model, which allows for weighted input of predictor variables. This enabled us to validate the results obtained from the supervised models and to assess their robustness. We likewise selected one non–tonal variety and one tonal variety for comparison: Seoul and Yanbian, respectively. The latter is a tonal variety based on the Hamgyong (Northeastern) dialect and, in contrast to the Gyeongsang dialect–which also retains lexical pitch accent–has been the subject of considerably less discussion. In terms of the parameters under investigation, in addition to the extensively studied VOT and f0, we also included voice quality–related measures to examine in comparison to the former two cues, the extent to which voice quality may serve as an alternative cue–particularly when phonologically encoded suprasegmental components need to occupy the f0 resource. Several studies have demonstrated that the ternary contrast can indeed induce systematic differences in the voice quality of the following vowel nucleus (e.g., Gao et al., 2021; Jang et al., 2024). While Oh & Yang (2013) previously explored this issue, their analysis was based on spectral features extracted from acoustic signals. In the present study, we drew on electroglottographic (EGG) signals, which provide a more direct reflection of glottal activity than acoustic signals, particularly in specifying phonatory features relevant to voice quality.
Based on the above introduction, the present study has two primary aims. At the linguistic–phonetic level, we seek to examine how multiple phonetic cues contribute to the Korean ternary stop contrast across different dialects using quantifiable methods, and to replicate previous findings. At the methodological level, we aim to develop a framework–grounded in a series of machine learning algorithms–for quantitative estimation and direct inter–dialectal comparison. This includes both the computation of feature importance and the evaluation of result robustness. We hypothesize that in the tonal Yanbian Korean, the contribution of f0 to distinguishing the stop triplet will be smaller than in the non–tonal Seoul Korean, and that the overall pattern of cue contributions will accordingly exhibit a systematic distinction. We also acknowledge the limited sample size and the gender imbalance in our data (see the next section), which may constrain the generalizability of the findings to the whole dialect level. To mitigate these limitations, we sought to enhance the robustness of our findings through analytic design and, contingent on future opportunities, plan to enlarge the dataset to permit more comprehensive validation.
2. Methods
Four native speakers of Seoul Korean (4M, mean=21, SE=4.01) and four of Yanbian Korean (2F & 2M, mean=27, SE=5.73) participated in this study. None of the participants reported any speech or hearing disorders. The study was approved by the Ethics Committee of Shanghai Normal University. All participants provided written informed consent and were compensated for their participation.
The CV–structured target syllables consisted of a stop onset varying in laryngeal series (lenis, fortis, aspirated) and place (labial, alveolar, velar), followed by one of the five Korean base vowels (/i, e, a, o, u/). This yielded a total of 45 target syllables (3 series×3 places×5 vowels). Given the difficulty of assembling triplets of real lexical items with comparable morphosyntactic structures and frequencies, we followed Gao et al. (2021) and instructed participants to produce the monosyllabic target syllables within the carrier phrase /X–ta/, where /ta/ (–다) functions as a copula. The most plausible interpretation of this phrase is “This is X,” analogous to spelling out a monosyllable. In such a case, the entire accentual group follows an HL intonational pattern, with the focused target syllable receiving an H tone. Participants were instructed to repeat each phrase three times, resulting in 540 tokens per dialect for analysis. A fixed presentation order was adopted to maximize intonational consistency throughout the task.
An electroglottograph (Laryngograph EGG-D200; Laryngograph, Wallington, UK). and an electret condenser microphone (Sony ECM-PCV80U; Sony, Tokyo, Japan) were connected to a laptop computer via an audio interface (Focusrite Scarlett Solo, 4th Gen.; Focusrite, High Wycombe, UK). Speech materials were presented on a separate computer. Acoustic and EGG signals were recorded simultaneously using Audacity (v3.7.1) at a 44.1 kHz sampling rate with 16–bit PCM encoding.
As noted earlier, the present study measured VOT, f0 and voice quality–related parameters. Only with the exception of using the acoustic burst peaks to detect the oral release timings when calculating VOT, all calculations were based on EGG signals. Therefore, the present study emphasizes articulatory dynamics rather than acoustic correlates.
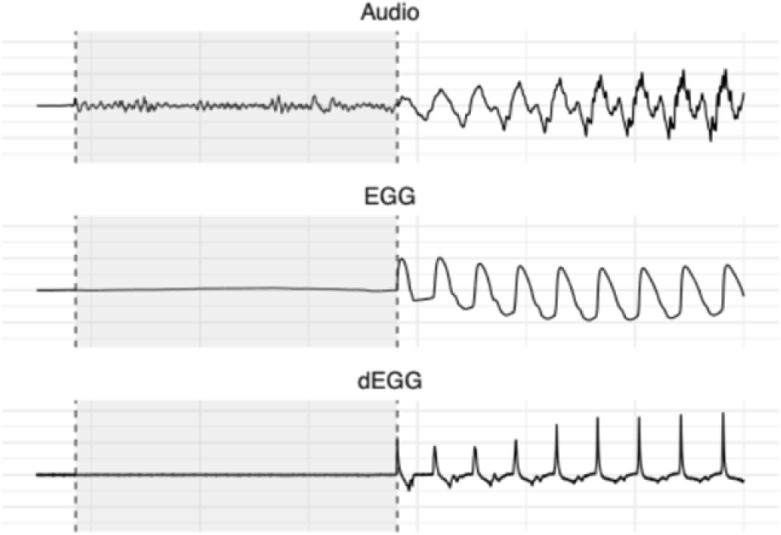
Compared to calculating VOT and f0 based on acoustic signals, the EGG signals are minimally affected by oral–tract articulation and more directly reflect vocal–fold activities. This advantage is especially salient for aspirated stops: within periodic cycles immediately adjacent to the oral release, high–frequency turbulent airflow often reduces periodicity in the acoustic signals, obscuring the identification of voicing onset. In contrast, the EGG waveforms affords relatively unambiguous detection of the first vibratory cycle. As exemplified in Figure 1, VOT was defined as the interval between the burst peak of the oral release in the acoustic waveform and the first glottal closure instant in the EGG signal, identified as the peak of the first derivative of the EGG waveform (Henrich et al., 2004). f0 was measured exclusively from the EGG waveform and calculated as the average of the two closest consecutive cycles following the oral release.
Voice quality is closely related to laryngeal activity, particularly phonatory behavior. Variations in voice quality can be captured by acoustic measures (see Gordon & Ladefoged, 2001). However, because EGG signal is recorded at the laryngeal level, it more directly reflects the source control underlying variations in voice quality. In the next paragraph, we will describe the analysis of EGG recordings and the related parameters. Previous studies have identified systematic differences associated with the ternary contrast in Korean stops across various types of data, including spectral and cepstral features from acoustic signals (Jang et al., 2024), EGG data (Gao et al., 2021; Li & Zhang, 2020), and even direct visual evidence from fiberscopic inspection (Kagaya, 1974). The results of these studies consistently indicate that the fortis series is produced with a narrower glottal aperture than the other two series. However, findings regarding the remaining two series–lenis and aspirated–have varied across different studies.
EGG signals have traditionally been analyzed by detecting landmarks corresponding to glottal events such as closure and opening within the waveform. By calculating the relative timing ratios within each vibratory cycle, phonatory properties can be specified. More detailed information on this landmark–based approach can be found in Baken & Orlikoff (2000:393–451). The most commonly referenced landmark parameters include contact quotient (CQ), speed quotient (SQ), and peak increase in contact (PIC), all of which reflect aspects of glottal aperture during phonation–more specifically, the degree of creakiness or breathiness in voice quality (Esling, 1984; Esposito, 2012; Esposito & Khan, 2020; Keating et al., 2011; Kuang & Keating, 2014; Rothenberg & Mahshie, 1988). However, landmarks are not always reliably detectable in the EGG waveform, and accordingly, the parameters derived from them do not consistently yield stable estimates of phonatory properties. In light of these limitations, Mooshammer (2010) and Kuang & Keating (2014) adopted an approach that combines functional data analysis (FDA) with principal component analysis (PCA), commonly referred to as functional principal component analysis (FPCA). In both studies, FPCA effectively captured stable patterns of variation in the overall geometric shapes of the EGG waveforms, even when the magnitude of such variation was subtle. Its reliability is evidenced by the fact that the factor scores of each principal component computed for the tokens usually exhibit stable correlations with relevant conditions (e.g., category, gender, etc.). The first derived principal component (PC1), which accounts for the largest proportion of variation in the EGG shapes, is typically associated with the variation in glottal aperture–controlled by medial compression tension in the glottis (Laver, 1980:108–109). This association has been consistently observed in the two aforementioned studies, and the same holds true in the present study (see details below). This consistency likely stems from the fact that such type of glottal tension is robustly related to linguistic contrast and thus remains an informative indicator even across variations in speaker identity or gender. Furthermore, the explanatory power of FPCA is evidenced by the fact that PC1 alone can capture the essential information– specifically, information that corresponds to what is estimated by multiple discrete landmark parameters such as CQ, SQ, and PIC (Kuang & Keating, 2014)–from the geometric properties of the EGG shapes. From the perspective of modeling, using the more information–dense PC1 factor score alone–rather than incorporating multiple discrete landmark parameters as predictors–can reduce unnecessary model complexity and thereby improve the interpretability of the results. Moreover, potential collinearity among multiple landmark parameters may dilute the estimation of feature importance, thereby compromising result accuracy. For these reasons, the present study followed the procedures outlined in Mooshammer (2010) and Kuang & Keating (2014), applying FPCA to extract principal components. The factor scores of the principal component that clearly varies with glottal aperture during phonation were then used as the index of voice quality variation.
In the present study, Following the “3/7 threshold” proposed by Howard and colleagues (Howard, 1995; Howard et al., 1990), two vibratory cycles adjacent to the stop onset were extracted from the vowel interval of each token. During preprocessing, the duration of each sample was normalized to 1,000 sampling points using linear interpolation. As absolute amplitude was not the focus of this analysis, each sample was linearly scaled such that the two opening peaks and two closure peaks were set to 0 and 1, respectively. Duration normalization was of crucial importance, as f0–which also reflects periodic duration–was included as a separate parameter in the present study. By normalizing duration, the temporal variation was removed from the FPCA computation, thereby reducing redundancy and enhancing the parsimony of the model to be fitted. The preprocessing of the EGG data was implemented in MATLAB using custom–written code (vR2024a; The Math Works, 2024). The preprocessed samples were then transformed into functional data using a Fourier basis expansion with 200 basis functions. Smoothing was applied using a third–order differential penalty, with the smoothing parameter λ set to 1e−12. FPCA was conducted on the combined dataset of Seoul and Yanbian speakers in R, using the fda package (Ramsay, 2024). The resulting factor scores were computed as projection distances from the grand mean, without any differences in scaling across dialects, thereby allowing direct comparison of results between the two varieties.
We employed linear discriminant analysis (LDA; supervised, linear) and random forest (RF; supervised, non–linear) to estimate the cue importance for the three parameters in Seoul and Yanbian Korean, and used K–means clustering (unsupervised) to assess the robustness of the results. This multi–view approach to cue–importance estimation triangulates evidence about the same predictor set under differing modeling assumptions, thereby increasing the robustness of the results. Patterns of agreement and divergence across models serve as diagnostics: discrepancies can reveal salient properties of the data and its processing. These insights, in turn, guide more effective model complementarity and sharpen the understanding of the research question.
The modeling was conducted in R (version 4.1.1; R Core Team, 2024); relevant packages will be identified at the corresponding subsections below.
3. Results
We first report the outcome of the FPCA. Figure 2 displays the first four principal components derived from the FPCA conducted on the dataset used in the present study. In each panel, the solid black line represents the grand mean trend across all samples, while the dotted grey lines–marked with plus and minus signs–illustrate variation patterns in the positive and negative directions of each component. PC1 alone accounts for over half of the variation (57.60%). The geometric variation it captures can be characterized in terms of pulse width, symmetry, and the sharpness of the rising slope near the glottal closure instant. These features closely correspond to those reflected by the landmark parameters CQ, SQ, and PIC, respectively–all of which are typically associated with glottal tension controlled by medial compression. In contrast, the other three principal components account for substantially less variation. Visual inspection reveals that, unlike PC1–which captures global differences in pulse shape–these components primarily reflect localized variation within specific segments of the waveform. As such, they are difficult to interpret in relation to certain phonatory factors involved in speech production. We therefore adopted the EGG–derived PC1 factor scores as the index of quantifying such type of glottal tension, rather than using a set of landmark parameters as in most previous studies. Unless otherwise noted, all references to “glottal tension” henceforth denote the phonatory property indexed by this EGG–derived PC1 factor scores. Due to space limitations, PC2–PC4 are not discussed further.
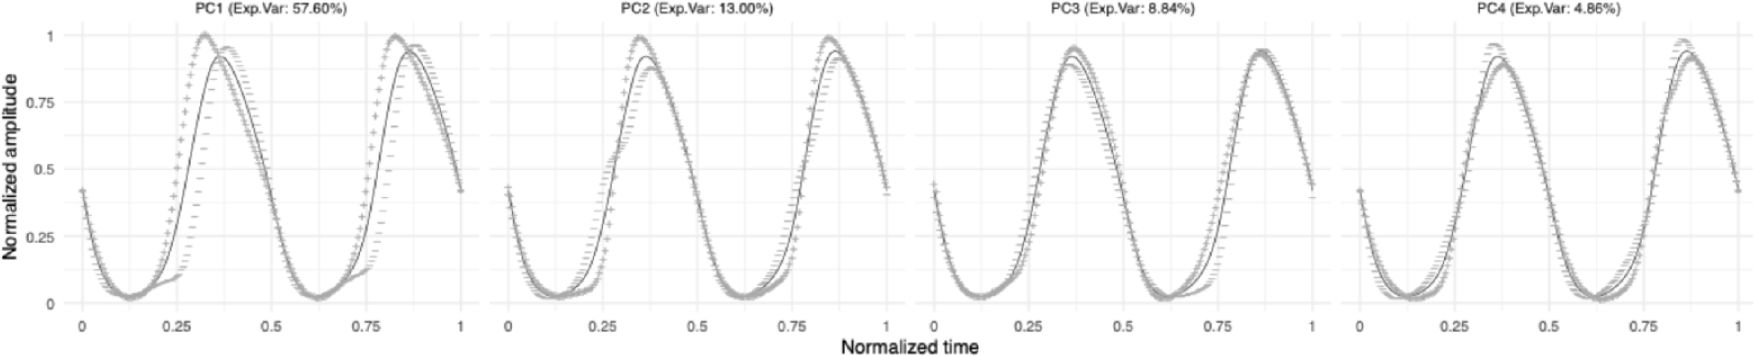
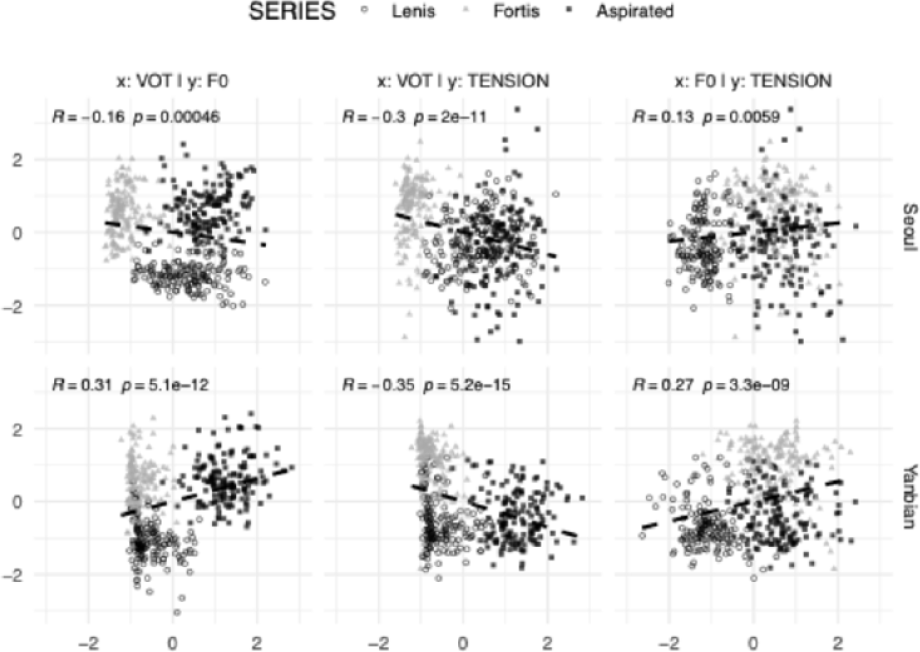
Figure 3 presents scatter plots and fitted linear regression lines for all pairwise combinations of the three parameters, showing the distributions of lenis, fortis, and aspirated stops in dual–dimensional spaces. All values were z–scored within participant (i.e., standardized per speaker) to minimize absolute differences induced by physiological factors, enabling us to focus on the contrast between stop series. In each panel, the upper–left corner reports the estimated pairwise Pearson linear correlation coefficient between the two parameters for the corresponding “pair×dialect” group. Across all groups, the absolute magnitudes of the pairwise Pearson correlations were small to moderate (|R|<.35), indicating limited collinearity among the parameters. We suspect that the very small p–values arise from spurious correlations induced by the distributional separation between stop series when tokens are projected into the dual–dimensional space–i.e., the stop series functions as a confounder. When correlations were re–estimated within each stop series, the coefficients dropped to negligible levels (mean |R|=.133, SE=.015). We therefore conclude that, in the present data, the three parameters are not virtually intercorrelated, and subsequent evaluations of feature importance are unlikely to be diluted by multicollinearity.
Our results largely replicate patterns reported in previous studies. For the glottal tension controlled by medial compression–as indexed by the EGG–derived PC1 factor scores–the fortis series exhibits higher values than the other two. In terms of f0, the lenis series shows lower values than both the fortis and aspirated series. VOT displays a dialect–specific pattern: in Seoul Korean, the lenis series has merged with the aspirated series, whereas in Yanbian Korean, it has merged with the fortis series.
Separate linear mixed–effects models were fitted to the data from each dialect in R using the lmer() function in the lmerTest package (Kuznetsova et al., 2017). Fixed effects were stop series, place of articulation, and vowel. The random–effects structure included by–participant intercepts and by–participant slopes for each fixed effect. For Yanbian Korean, because the sample comprised both female and male speakers, gender was added as an additional fixed effect. By–gender slopes were excluded because they resulted in singular fits. Repetition was excluded as a predictor, as it did not improve model fit according to AIC and BIC. Pairwise comparisons of estimated marginal means (EMMs) among the three stop series were conducted using the emmeans package, with Tukey adjustment for multiple comparisons (Lenth, 2025). No significant differences in glottal tension were found for any of the three pairs in Seoul Korean (lenis–fortis: β=−0.959, t=−2.338, p=.193; lenis–aspirated: β=−0.043, t=−0.381, p=.993; fortis–aspirated: β=0.917, t=3.456, p=.081), nor for the lenis–aspirated pair in Yanbian Korean (β=−0.234, t=−1.235, p=.514). Likewise, no significant f0 differences were observed between fortis and aspirated stops in either dialect (Seoul: β=−0.094, t=−0.369, p=.929; Yanbian: β=−0.103, t=−0.713, p=.774). Finally, in Seoul Korean, the VOT contrast between lenis and aspirated stops did not reach statistical significance (β=−0.456, t=−2.876, p=.124). For full model details and the pairwise comparisons of EMMs, see the Appendixs 1 and 2.
Additionally, we calculated overlap coefficients for each parameter across the three pairwise comparisons among the stop series in both dialects. In R, Kernel density functions were first estimated using the density() function. For each pair of series, the overlap coefficient was then computed by integrating the pointwise minimum of the two corresponding density curves (Inman & Bradley, 1989). The formal specification is given in (1) below. The resulting coefficient ranges from 0 to 1, where lower values indicate greater distributional separability along a given dimension, and higher values reflect substantial overlap and reduced discriminability. Table 2 displays the computed overlap coefficients with 95% confidence intervals (CI).
In the present study, we fitted LDA models in R using the MASS package (Venables & Ripley, 2002), with the three measured parameters as predictors and stop series as the response. LDA is a supervised, linear classification method that projects the data into a lower–dimensional space. It assumes that observations in each class (here, stop series) are drawn from a multivariate normal distribution with a common covariance matrix. With three classes, the model yields up to two discriminant functions, estimated to maximize the ratio of between–class to within–class variance.
From the fitted model, we obtained the scaling coefficients (loadings) of each predictor on the two discriminant functions; these coefficients specify the weight and sign of each variable in constructing the discriminant axes. We then computed, for each predictor, the Euclidean norm of its two–coefficient vector as an index of its overall contribution in discriminant space. Finally, we normalized these norms by their sum to express the relative importance of the predictors in the classification task. Given the relatively small number of participants in this study, we additionally assessed the robustness of the results to potential speaker–specific idiosyncrasies by conducting leave–one–out cross–validation (LOOCV) separately for each dialect. On each iteration, the data of one participant were held out as the test set and the remaining participants formed the training set. With four participants per dialect, the training–test ratio was 3:1.
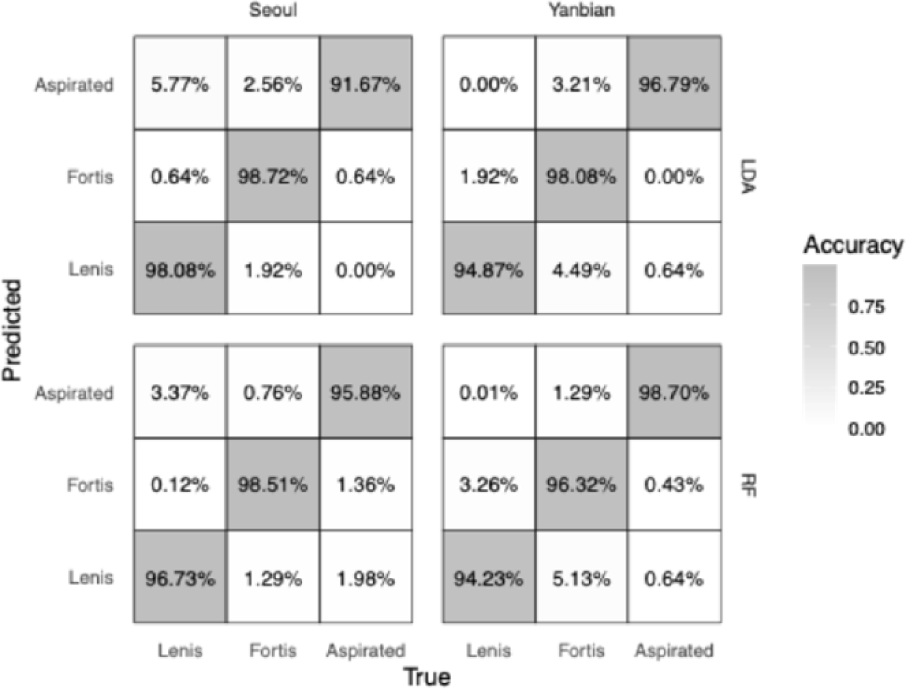
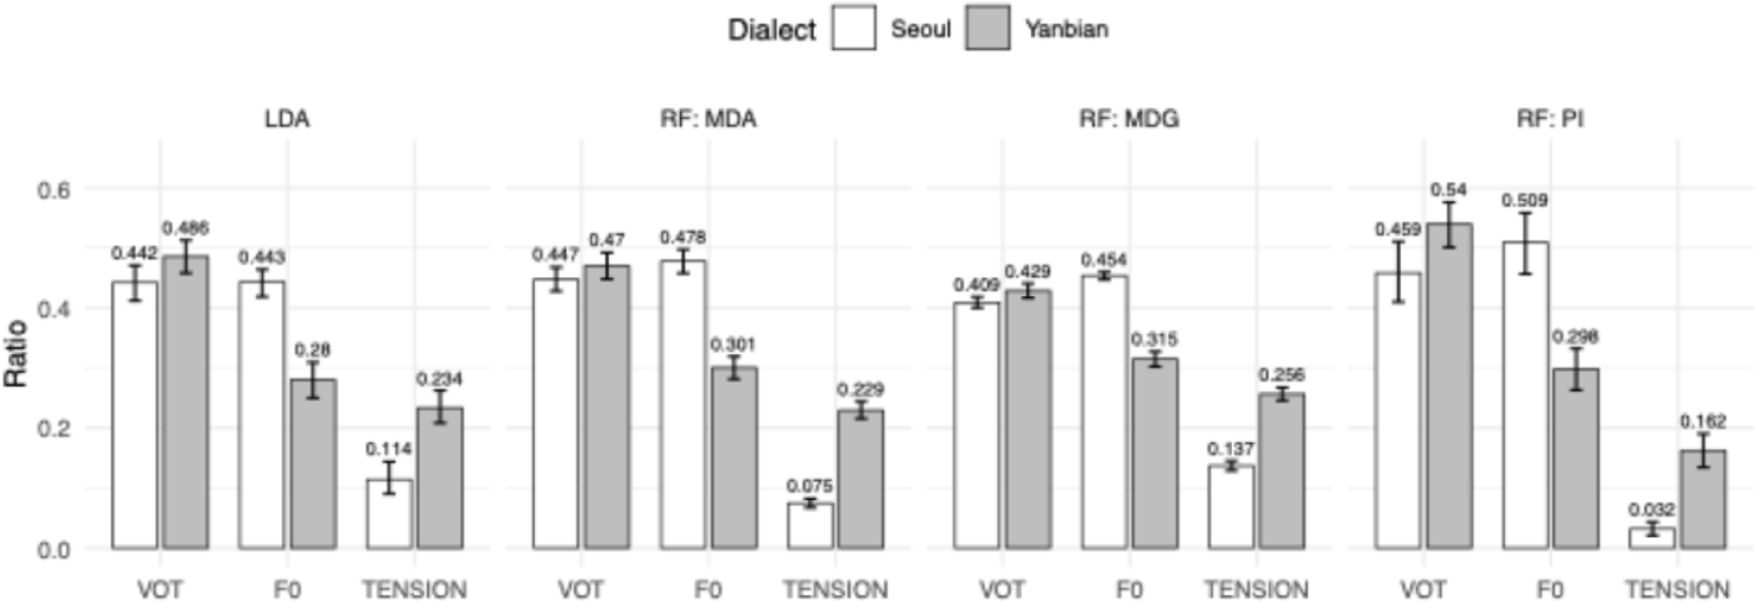
For models trained on the full dataset, classification accuracy was high for both dialects (Seoul: 96.15%; Yanbian: 96.58%; see confusion matrices in the upper row of Figure 4). The LOOCV accuracies across iterations closely matched the full–data results (Seoul: mean=95.94%, SE=1.65 pp; Yanbian: mean=95.30%, SE=2.33 pp). The leftmost panel in Figure 5 displays the cue–importance results derived from the LDA models. The contribution structure differs markedly across the two dialects. In Seoul Korean, VOT (0.442) and f0 (0.443) contribute virtually equally, whereas glottal tension (0.114) plays a minor role. In Yanbian Korean, VOT shows the largest contribution (0.486); f0 (0.280) is not only lower than VOT but also lower than its contribution in Seoul. Glottal tension, while the smallest contributor within Yanbian (0.234), is nevertheless greater than in Seoul.
RF classification models were fitted in R using the randomForest package (Liaw & Wiener, 2002), with the same predictor set as in the LDA models (ntree=500). RF is a nonparametric ensemble method that builds a large number of decision trees on bootstrap–resampled training sets; at each split, a random subset of candidate predictors is considered when selecting the optimal partition. This strategy reduces variance, mitigates overfitting, and captures nonlinear relations and interaction effects among predictors. Class labels are assigned by majority vote across trees (Breiman, 2001).
We extracted three commonly reported RF variable–importance metrics: (1) Mean Decrease in Accuracy (MDA)–the drop in out–of–bag prediction accuracy when a predictor is permuted; (2) Mean Decrease in Gini (MDG)–the cumulative reduction in node Gini impurity attributable to that predictor across all trees; and (3) Permutation Importance (PI)–the change in overall classification accuracy when the predictor is permuted across the full set of input data. To enhance estimation robustness, we trained 1,000 replicate RF models for each dialect. Consistent with the LDA procedure, we also applied LOOCV to the RF. Within each forest, important scores were rescaled to proportions (each score divided by the sum across predictors).
The RF models achieved classification accuracies of 97.04% for Seoul Korean, and 96.42% for Yanbian Korean; the corresponding confusion matrices are shown in the lower row of Figure 4. LOOCV produced comparable results: 96.58% for Seoul (SE=1.67 pp), and 94.44% for Yanbian (SE=3.13 pp). The rightmost three panels in Figure 5 displays the proportion–normalized cue–importance patterns of MDA, MDG, and PI. The three RF metrics yielded broadly similar patterns and were largely consistent with the aforementioned LDA results. The three metrics also differ in their absolute magnitudes, reflecting differences in how they are computed. MDG captures the extent to which a feature is selected for splitting during tree induction; it is susceptible to biases toward continuous or high–cardinality predictors, to the overweighting of shallow splits, thereby tending to inflate “easy–to–split” but secondary cues. PI quantifies the realized loss in generalization performance when the association between a feature and the outcome is disrupted; because redundant or only locally informative cues can be substituted by other variables, PI typically assigns higher scores to primary cues and lower scores to secondary ones. MDA, though likewise permutation–based, is evaluated on out–of–bag (OOB) subsamples and is coupled with the bootstrap sampling used in training; consequently, it tends to exhibit larger variance and a dilution effect for correlated predictors. For these reasons, we synthesize evidence across all three metrics to maximize the robustness of our conclusions. When we averaged the proportion–normalized scores across the three RF metrics, the resulting ranking were: for Seoul, f0 (0.480)>VOT (0.438)>glottal tension (0.081); and for Yanbian, VOT (0.479)>f0 (0.304)>glottal tension (0.216).
To evaluate the cue–importance patterns obtained from the LDA and RF models, we conducted an unsupervised sensitivity analysis using weighted K–means clustering with the function kmeans() in R. Under a Euclidean metric, K–means tends to recover roughly spherical clusters of comparable variance; applying variable weights is equivalent to rescaling dimensions in feature space and thus allows us to probe how different cues shape the clustering structure. That is, the “weighting” here is implemented by rescaling the values of a given predictor, thereby manipulating absolute distances between the samples in relevant space and, in turn, modulating the amount of effective information that predictor can contribute at classification time. More specifically, if the weight of a secondary cue is inflated so that it crowds out information that would otherwise be supplied by the primary cue, the performance of the model should deteriorate; conversely, when relative weights assigned across predictors mirror their true standing in the data (i.e., cue importance), the predictive performance would be optimized.
Baseline weights were set to the arithmetic mean of the relative–importance values returned by the two supervised models (LDA and RF). If this weighting structure yields the best predictive performance, it corroborates the validity if the cue–importance estimates obtained from the two supervised models. For each dialect, we designated each predictor in turn as the focal variable and varied its weight from 0 to 1 over a uniform grid of 200 points (weights constrained to sum to 1); the remaining weight was distributed across the other predictors in proportion to their baseline values. For every weight vector, we ran K–means (k=3, nstart=20) to match the three stop series and reduce sensitivity to local minima. Clustering assignments were then compared with the true category labels, and the Adjusted Rand Index (ARI) was computed as the agreement metric using the mclust package (Scrucca et al., 2023). ARI corrects for agreement expected by chance; higher values indicate more faithful recovery of the known category structure (i.e., better predictive performance). Figure 6 (faceted by dialect) plots ARI as a function of the weight assigned to each of the three parameters; each curve traces the ARI obtained as the focal parameter’s weight is swept from 0 to 1. Abrupt changes in slope along a curve (i.e., sharp increases or decreases in ARI) indicate critical weight thresholds in cue–weighting space. When increasing the weight of the focal predictor produces a steep rise in ARI, that cue is entering an effective range and begins to structure the clustering solution. Conversely, a steep decline indicates that the cue drops below its effective range and loses influence. The former marks a shift from an under–informative weighting regime toward a functionally appropriate one; the latter marks the reverse.
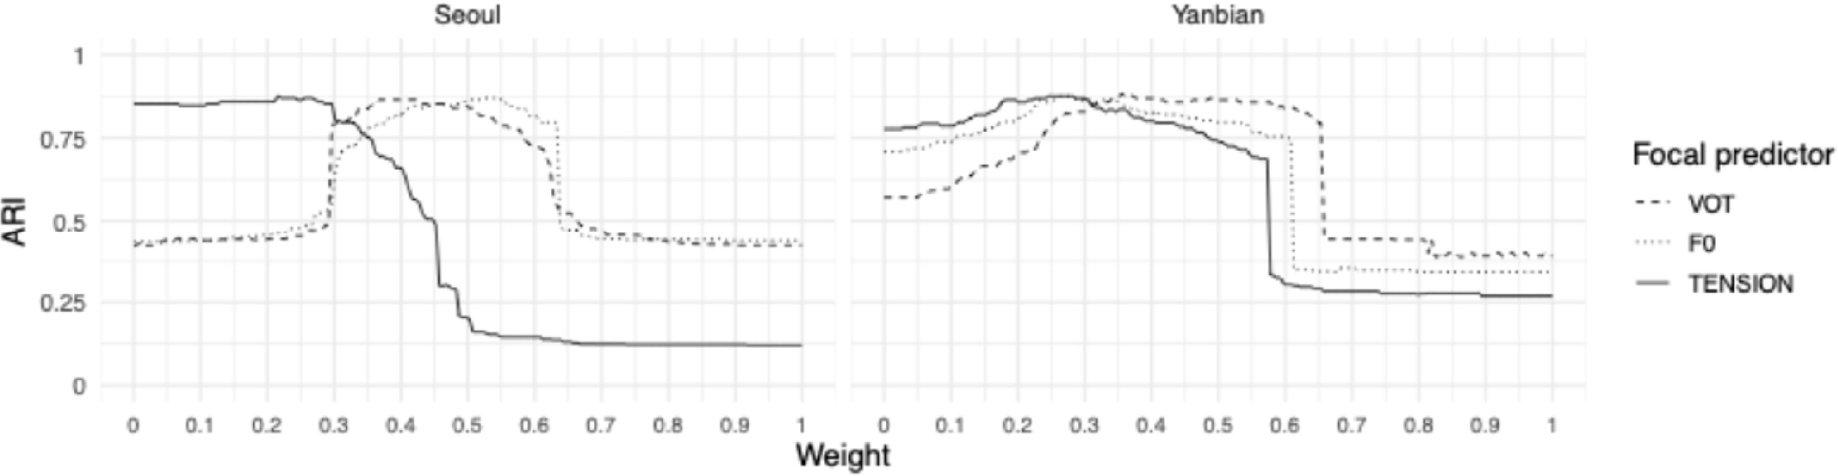
Inspections of the curve shapes reveal systematic cross–dialect differences. In Seoul Korean, the ARI curves obtained when sweeping the weight on VOT and f0 largely overlap and show an optimal plateau when the focal weight lies roughly between 0.3 and 0.6; the edges of this interval correspond to the abrupt changes noted above. Within this plateau, however, the two curves are offset: the VOT curve is slightly left–skewed, whereas the f0 curve is slightly right–skewed. This pattern suggests that clustering is most stable when VOT is relatively underweighted and f0 relatively overweighted within the admissible range, implying that f0 exerts the stronger influence. By contrast, the curve of glottal tension declines almost monotonically across the full 0–1 sweep, indicating an extremely limited contribution; it appears to function mainly as a supplementary cue that fine–tunes the boundaries once VOT and f0 have established the primary structure. Yanbian Korean shows a different pattern. All three curves rise gradually from weight 0, reach a maximum, and then drop sharply at about 0.6. This suggests that the cues function in a relatively balanced manner: overweighting any single parameter at the expense of the others degrades K–means performance. The three peaks are nevertheless staggered from left to right–glottal tension, f0, VOT–yielding the relative strength ordering VOT>f0>glottal tension, in line with the supervised models.
In summary, the K–means results corroborate the cue–importance patterns estimated by the LDA and RF models. First, the ARI curves recapitulate the rank ordering and overall pattern observed in the supervised analyses. Second, for each cue the ARI reaches (or very nearly reaches) its maximum when that cue’s weight is set to its supervised baseline value (Seoul: 0.847; Yanbian: 0.864).
4. Discussion
In the present study, we measured VOT, f0, and glottal tension for the stop triplet in Seoul and Yanbian Korean, largely replicating findings reported in prior research. Setting aside overlapping boundary regions between categories, a common pattern emerged across all three parameters: each was able to distinguish at least one series from the other two. This suggests that, phonologically, only two parameters may be sufficient to characterize the ternary contrast, with each series defined by a unique combination of two distinctive features. However, speech production involves the coordination of multiple articulatory gestures across distinct organic articulators. As such, the phonetic realization of any given contrast often engages more cues than the theoretical minimum required for phonological description, reflecting the inherently redundant nature of speech. Given that the aim of the present study is to achieve a finer–grained phonetic understanding, we further explore how these multiple parameters interact, based on our original analyses.
In both dialects, VOT and f0 emerged as the two most influential cues, although their relative rankings differed. We interpret this divergence in terms of cue informativeness–i.e., the extent to which a single cue effectively differentiates a given stop series from the other two. It is also reasonable to expect that when a particular cue fails to achieve clear separation between two series, the disambiguation is more likely to be handled by another cue within the model. In Seoul Korean, VOT most effectively distinguishes fortis stops from the other two series, with overlap coefficients of just 0.140 (vs. lenis) and 0.059 (vs. aspirated). By contrast, in Yanbian Korean, VOT is most informative for identifying aspirated stops, yielding even lower overlap coefficients of 0.093 (vs. lenis) and 0.025 (vs. fortis). These figures indicate that VOT provides more robust separation in Yanbian than in Seoul–at least for isolating one specific series–given that sample sizes are balanced across series. Similarly, f0 serves as the most effective cue for identifying lenis stops in both dialects, though again with varying precision: in Seoul, the overlap coefficients with fortis and aspirated series are 0.104 and 0.063, respectively; in Yanbian, they increase to 0.203 and 0.152. These values suggest that f0is a more informative cue in Seoul compared to Yanbian. Glottal tension, while consistently less important than VOT and f0 in both dialects, exhibits markedly different levels of discriminative power. In Seoul Korean, this cue yields overlap coefficients greater than 0.5 in all three pairwise comparisons. In contrast, in Yanbian Korean, glottal tension proves more effective in identifying fortis stops, with overlap coefficients of 0.234 (vs. lenis) and 0.327 (vs. aspirated).
Integrating these findings with the cue–contribution patterns reported in last section, we interpret the results as follows. In Seoul Korean, effective separation of the three stop series relies on the joint distribution of VOT and f0, while glottal tension contributes minimally–reflected in the roughly equal importance of VOT and f0, and a negligible contribution from glottal tension. In contrast, Yanbian Korean exhibits a more distributed cue pattern: each cue appears to specialize in identifying a specific series–VOT for aspirated stops, f0 for lenis, and glottal tension for fortis. This division of labor underlies the more balanced contribution profile. Nevertheless, the overlap coefficients reveal that, even within this structure, VOT remains the most effective cue, followed by f0, with glottal tension being the least effective. Accordingly, the internal cue ranking in Yanbian is: VOT>f0>glottal tension.
The preceding discussion can be further contextualized by considering broader linguistic properties of Seoul and Yanbian Korean. In distinguishing the stop triplet–a segmental–level contrast–Seoul Korean appears to make fuller use of f0, whereas Yanbian Korean adopts a more conservative strategy in deploying this cue. This asymmetry is interpretable in light of whether pitch is utilized for lexical purposes: Seoul Korean, being non–tonal, allows speakers to allocate f0 resources more freely to segmental contrasts. By contrast, Yanbian Korean, a tonal variety, relies on f0 to signal lexical distinctions, such that extensive use of f0 for segmental purposes may interfere with intended pitch targets at the word level. Accordingly, cues associated with voice quality–less likely to conflict with suprasegmental functions–may be utilized more robustly for distinguishing the stop triplet in Yanbian (Oh & Yang, 2013). A similar pattern has been observed in Gyeongsang Korean, which is also tonal (Lee & Jongman, 2012, 2018). An alternative explanation is that Yanbian speakers are bilinguals of Mandarin; the extremely high functional load of lexical tone in Mandarin may shape their articulatory strategies, yielding more robust utilization of voice quality. Nevertheless, because both voice quality and f0 are ultimately controlled by the same articulatory source–the laryngeal mechanism, with the glottis playing a central role–they cannot be fully disentangled. Therefore, the systematic f0 differences observed across stop series in Yanbian are more likely to reflect a low–level biomechanical byproduct, rather than a result of deliberate phonological targeting.
In terms of the predictive performances of the models, both LDA and RF broadly recovered the same cue–importance structure for Seoul and Yanbian Korean, and their results were largely concordant. The largest accuracy gap arose for Seoul aspirated stops, where LDA underperformed RF by 4.21 percentage points. This pattern is consistent with LDA’s modeling assumptions–approximately Gaussian class–conditional distributions with a common covariance matrix–which can lead to underfitting when relationships are nonlinear, within–class variances are unequal, or distributions deviate from normality; notably, Figure 3 shows the greatest dispersion for Seoul aspirated stops. Given the modest sample size in this study, performance disparities across models are likely to be more pronounced in larger, more parameter–rich datasets.
5. Conclusion
This study investigated how three phonetic cues–VOT, f0, and voice quality (specifically, glottal tension associated with medial compression)–contribute to the ternary laryngeal stop contrast (lenis, fortis, aspirated) in two Korean dialects: Seoul Korean (non–tonal) and Yanbian Korean (tonal). While most prior studies have explored this issue in terms of individual parameters, we introduced a machine learning–based classification approach to evaluate cue importance within an integrated framework. This allowed for interpretable and quantifiable estimation of each cue’s relative contribution. As expected, the difference in use of lexical pitch accent between the two dialects was reflected in their cue–weighting profiles. When summarized by rank order and functional categorization (primary, secondary, negligible), the patterns were: in Seoul, f0 (primary)>VOT (primary)>glottal tension (negligible); in Yanbian, VOT (primary)>f0 (secondary)>glottal tension (secondary).
We acknowledge the limited sample size in this study. However, the use of multiple modeling techniques and cross–validations enhance the robustness of our findings. Crucially, the approach is inherently extensible, allowing for expansion in both sample size and parameter inclusion. In addition to offering new insight into the phonetic realization of the Korean ternary laryngeal stop contrast, this study contributes a methodological framework that may serve as a foundation for future research. Since this study adopted an articulation–oriented perspective, a natural extension would be to replicate the analyses by substituting the focal parameters with their acoustic counterparts, providing a cross–validation that is informative both for the phenomena under study and for the generality of the methodological approach. We hope this study will facilitate further research and methodological refinement in this domain.