1. Introduction
This study seeks to identify the method that provides the most robust measurement of vowel formant frequencies in monophthongs produced in stressed syllables. Prior research has typically assessed vowel formants either at the midpoint (Ferragne & Pellegrino, 2010; Harrington, 2010; Harrington et al., 2000; Renwick & Ladd, 2016) or at the one-third point (Yang, 1996) of the vowel interval, positions traditionally regarded as the most stable portions of the vowel. A single midpoint is often chosen because it minimizes the influence of surrounding sounds. The vocal tract is often maximally open (F1) for non-high vowels, and F2 often reaches a maximum in /i/ or a minimum in /u/ near the temporal midpoint (Harrington, 2010). Measurements at the onset or offset of the vowel interval have generally been avoided due to potential coarticulatory influences from adjacent segments. Ideally, the steady-state point of a vowel should be visually identified. However, this approach is impractical for large corpora, as it is difficult to maintain consistency in identifying steady states within dynamic formant movements, and the procedure does not readily lend itself to automation.
Renwick & Ladd (2016) reduced formant tracking errors by setting different numbers of formants and different maximum formant frequencies for male and female speakers: 4,500 Hz with five formants for males, and 5,000 Hz with four formants for females. Yang (2022) notes that when extracting lower formant frequencies, setting the number of formants to five increases the likelihood of misidentifying two formants as one, particularly for rounded back vowels.
Bauer (1985), by contrast, measured multiple points at 10-ms intervals throughout the steady-state portion of vowels to ensure a more reliable picture of formant frequencies.
When comparing monophthongs with diphthongs, multiple measurements are often taken at 20% and 80%, and sometimes also at 50% of vowel duration.
The objective of the present study is to evaluate the relative reliability and validity of single-point approaches by comparing them with alternative methods that incorporate multiple points, or all points, across the vowel interval in formant frequency measurement.
2. Database
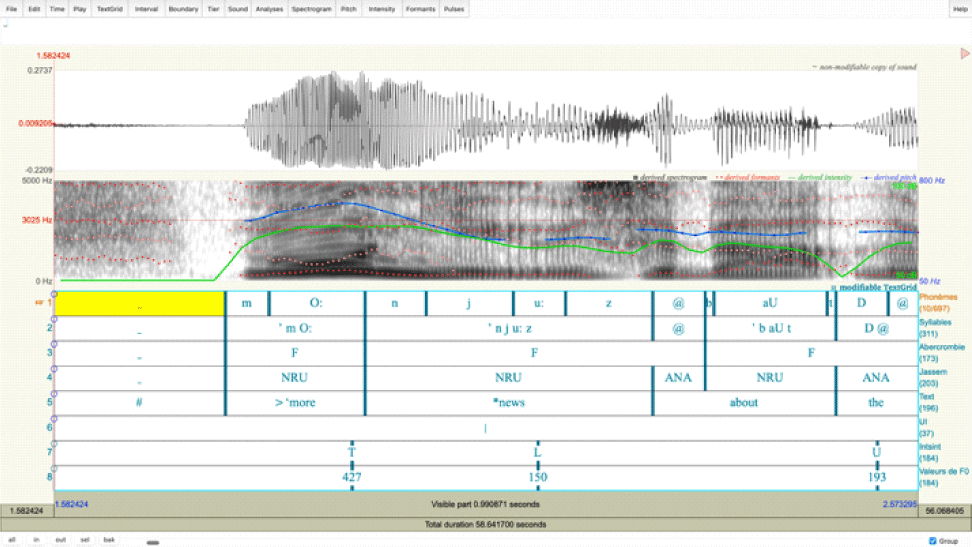
In this study, the Aix-MARSEC database (Auran et al., 2021) was used for analysis. This database is an expanded version of the Spoken English Corpus (SEC), which contains approximately five and a half hours of recordings from BBC broadcasts. The SEC initially collected recordings from 17 male speakers and 36 female speakers in the 1980s. The Aix-MARSEC database currently provides sound files for 29 male speakers and 10 female speakers, along with corresponding TextGrid files containing eight annotation tiers: phonemes, syllables, feet, rhythm units, words, intonation units, intonation patterns, and target pitches (Figure 1).
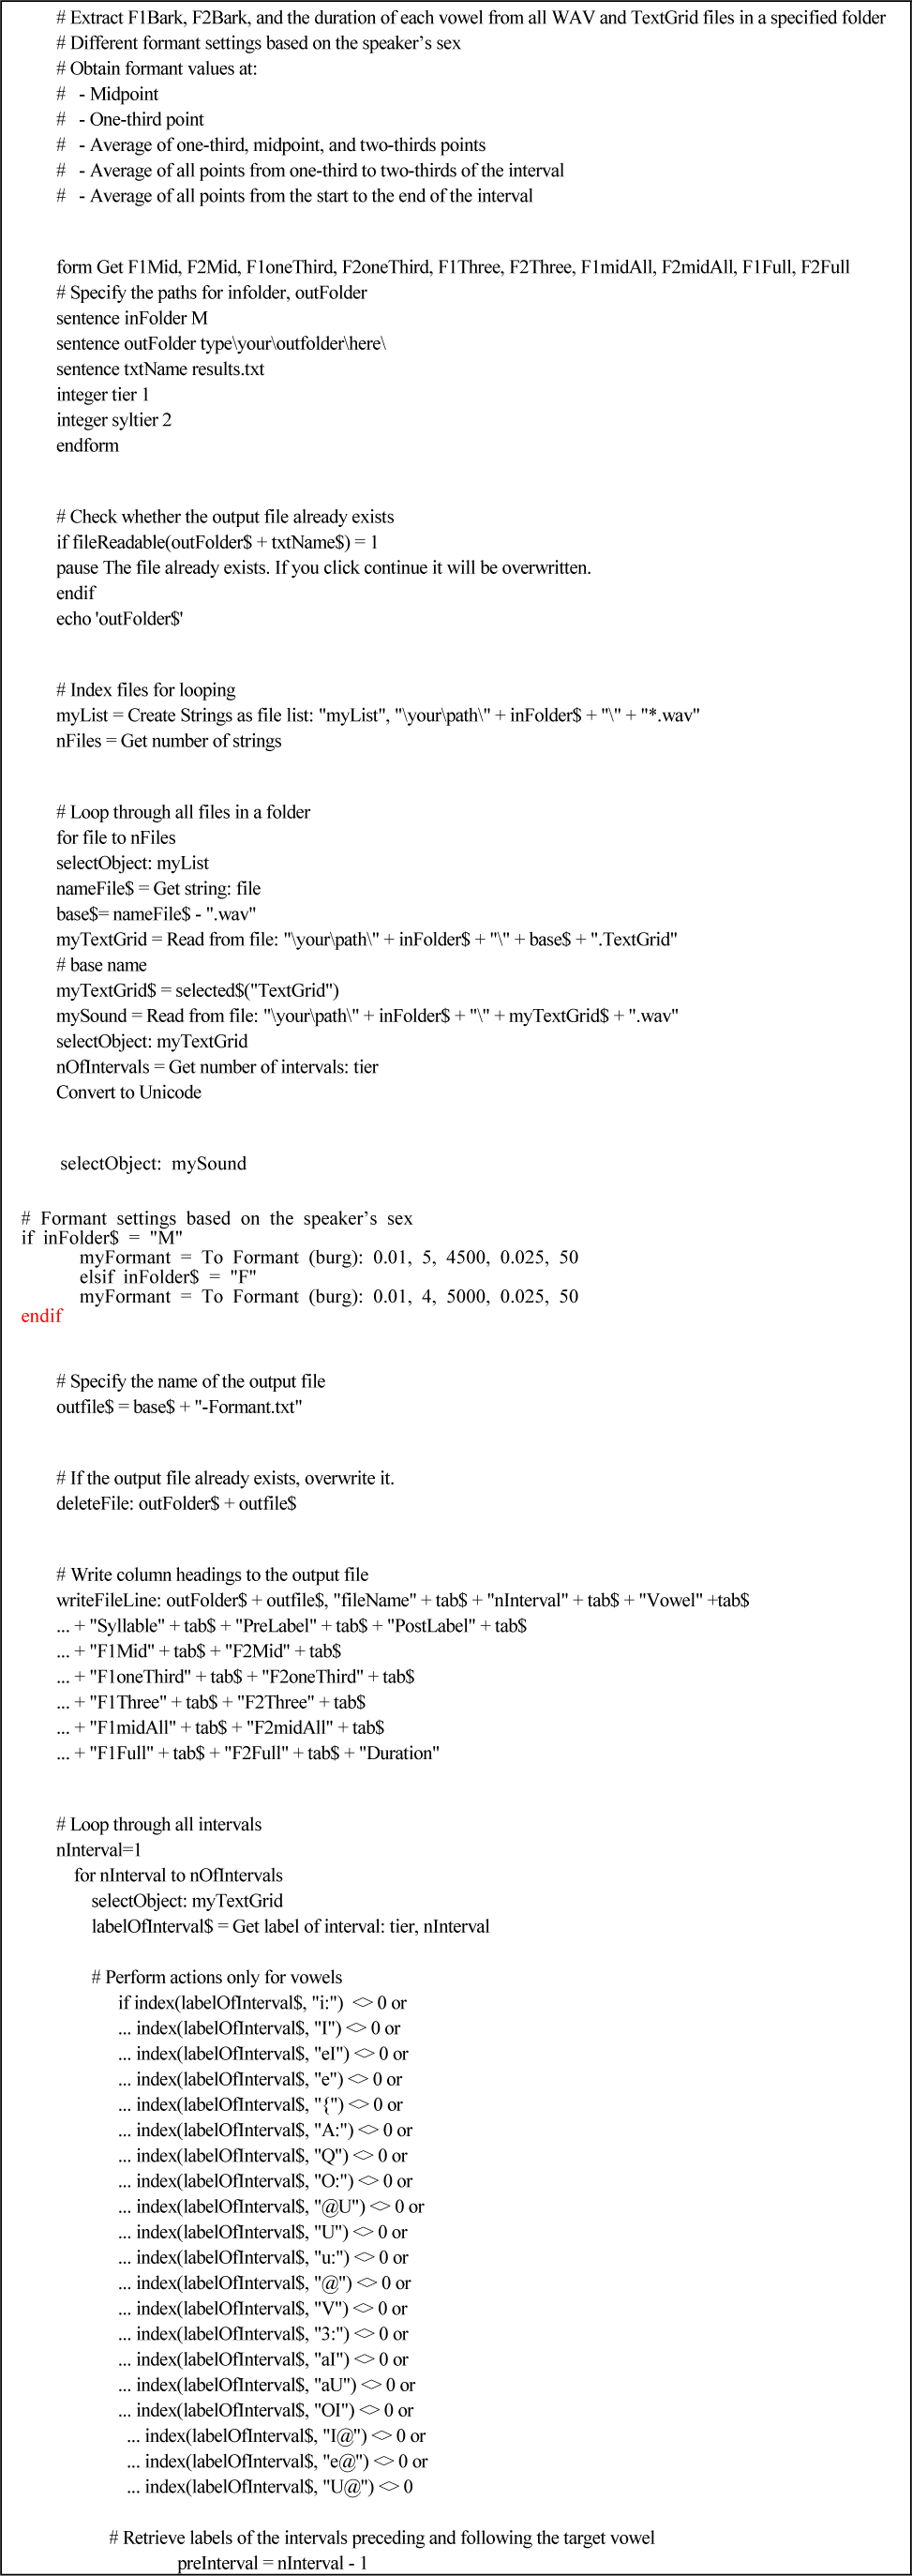
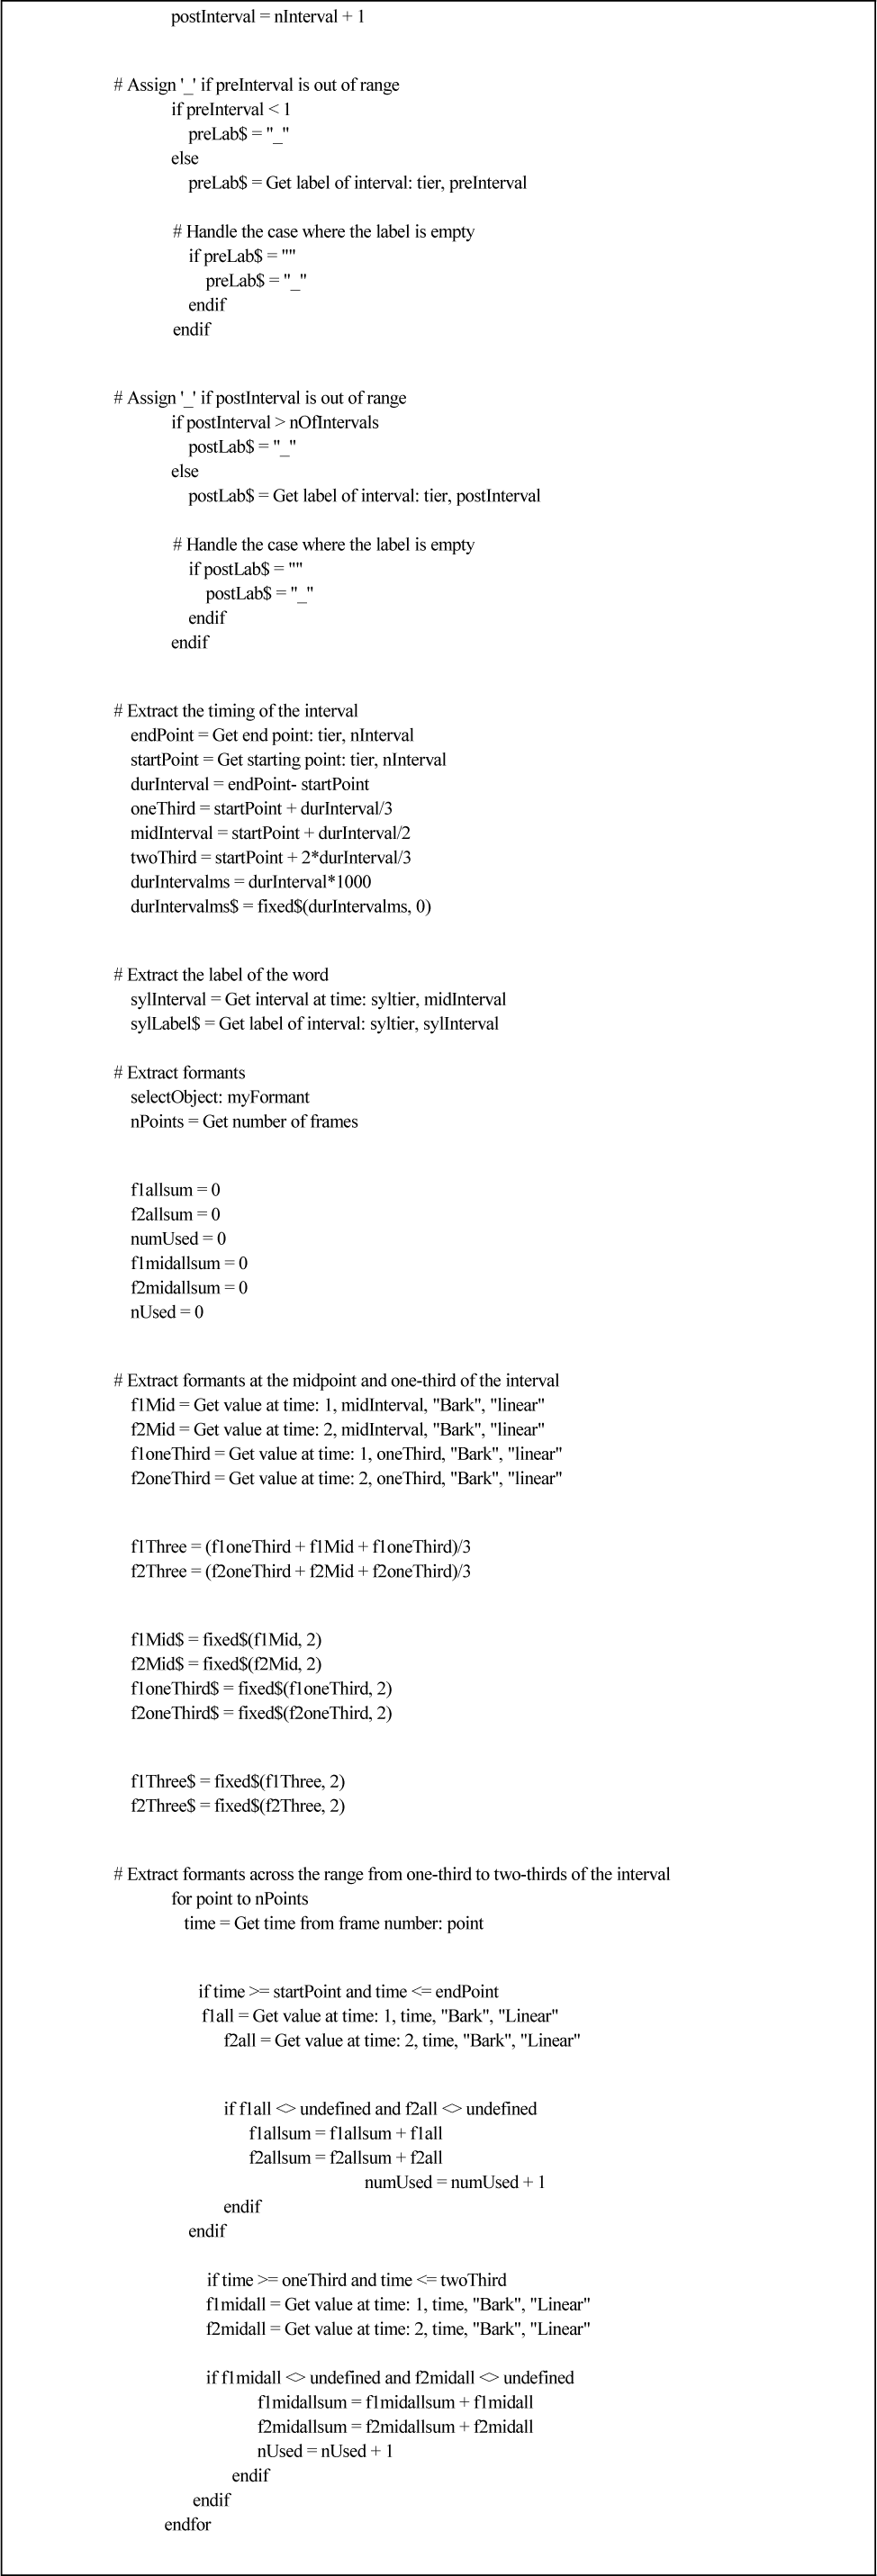
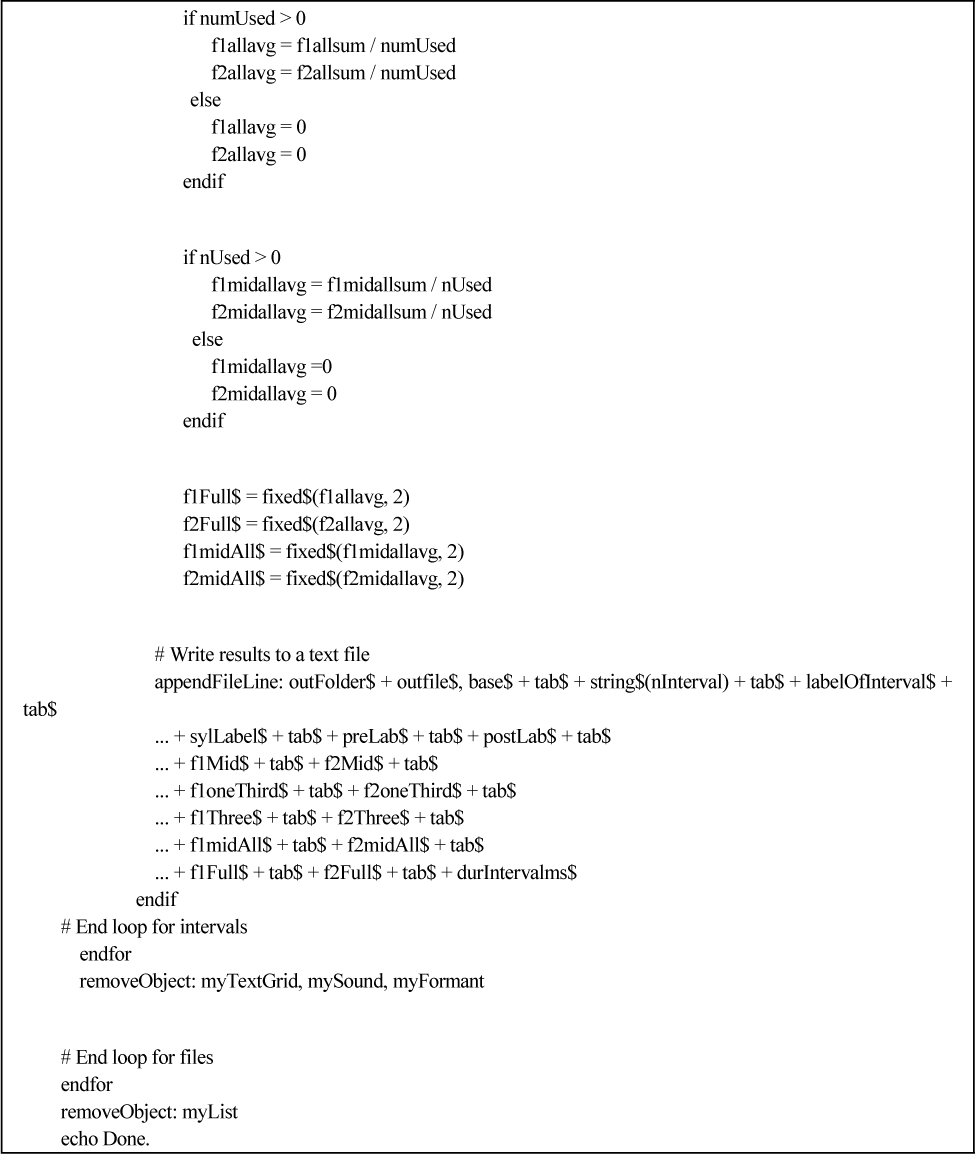
Because multi-level annotations were manually produced in the Aix-MARSEC project, no additional processing was required for this study. We used the tiers containing information on phonemes and syllables. Phonemes are transcribed in Speech Assessment Methods Phonetic Alphabet (SAMPA; Wells, 1997). A Praat script (Appendix 1) was written to obtain Bark values of the first formant frequency (F1Bark) and the second formant frequency (F2Bark) at several time points: the midpoint (Mid), the one-third point (OneThird), three equally spaced points between one-third and two-thirds (Three), all points between one-third and two-thirds (MidAll), and all points from the beginning to the end of the vowel interval (Full). If multiple points were used, the average was extracted. Diphthongs were excluded from the analysis, as their formant frequencies fluctuate over time. Table 1 summarizes the measurement methods used in this study.
In the script, a list was generated to read all sound and TextGrid files in a specified folder using the “Create Strings as file list” function in Praat. Then, in a loop, the sound files and their corresponding TextGrids were imported one by one. Each sound file was converted into a formant object using the “To Formant (burg)” function. Following Renwick & Ladd (2016), different formant settings were implemented in the script. For male speakers, five formant frequencies were extracted with a frequency ceiling of 4,500 Hz, whereas for female speakers, four formant frequencies were extracted with a frequency ceiling of 5,000 Hz, as shown in Table 2.
Within an embedded loop, only monophthongs were selected, and the time interval for each vowel was extracted. From these intervals, vowel and syllable labels, formant frequencies (in Bark), and vowel durations were obtained. No undefined values were encountered in the measurements. The syllable tier in the Aix-MARSEC database also encodes stress information. For example, the word “good” bears primary stress on [’ g U d], whereas “unification” carries secondary stress on [, j u]. This information was used to identify vowels in stressed syllables.
All output files were then merged, and only stressed vowels with a duration greater than 40 ms were retained. Because at least three time points were required to calculate formants for multi-point methods, vowels shorter than 40 ms were excluded, given the 10-ms time step of the formant analysis. To minimize coarticulatory effects, vowels following /j/, /w/, or /ɹ/ and those preceding /l/ were also excluded (Deterding, 1997; Harrington et al., 2000).
Two datasets were prepared to calculate the means of F1Bark, F2Bark, and the Euclidean distances of individual vowels from the centroid of each vowel by sex. The first dataset included outliers, while the second excluded them. This allowed us to assess whether extreme formant values could influence the results. Harrington (2010) manually identified and removed outliers in their study; in contrast, we removed outliers using z-score filtering (±2.5 SD) applied to each vowel for each speaker. This threshold covers about 98.76% of data points, leaving about 1.24% as potential outliers (Pollet & van der Meij, 2017), and thus provides a good balance. Outliers in any measurement were removed across all data, ensuring that the same tokens were analyzed regardless of method. Finally, the SAMPA transcriptions were converted into IPA symbols. Table 3 presents the number of vowel tokens in the two datasets.
3. Results
Tables 4–7 present the means and standard deviations of F1Bark and F2Bark for each vowel in datasets without outliers.
Figure 2 illustrates the ellipses of each vowel within 2.5 standard deviations in the Full method. The letter representing each vowel marks the centroid of that vowel. Euclidean distances were calculated from this centroid to each token of the corresponding vowel.
A key observation is that the standard deviations of F1Bark and F2Bark obtained from multi-point measurements (Three, MidAll, Full) are consistently smaller than those obtained from single-point measurements (Mid, OneThird). In F1Bark, the smallest standard deviations appear more frequently in either the MidAll or Full method, whereas in F2Bark, they occur mostly in the Full method. Another noteworthy finding is that, regardless of method, back vowels such as /ɒ/, /ɔ/, /ʊ/, and /u/ exhibit larger standard deviations, especially in F2Bark. This suggests greater variability among speakers for words containing these vowels. For example, the first vowel of “following” is pronounced either as /ɒ/ or as /ɑ/ in the database.
These results suggest that when multiple points are used to measure vowel formant frequencies, the outcomes exhibit less variability and are therefore more reliable.
We further examined the global correlations of F1Bark and F2Bark across measurement methods within each sex to assess how similarly the methods perform. Results for the datasets without outliers are provided in Tables 8–11.
| Mid | OneThird | Three | MidAll | |
|---|---|---|---|---|
| OneThird | .88 | |||
| Three | .95 | .99 | ||
| MidAll | .98 | .91 | .96 | |
| Full | .90 | .80 | .93 | .93 |
| Mid | OneThird | Three | MidAll | |
|---|---|---|---|---|
| OneThird | .89 | |||
| Three | .95 | .99 | ||
| MidAll | .97 | .92 | .96 | |
| Full | .93 | .92 | .95 | .96 |
| Mid | OneThird | Three | MidAll | |
|---|---|---|---|---|
| OneThird | .91 | |||
| Three | .96 | .99 | ||
| MidAll | .98 | .93 | .97 | |
| Full | .90 | .90 | .92 | .92 |
| Mid | OneThird | Three | MidAll | |
|---|---|---|---|---|
| OneThird | .87 | |||
| Three | .94 | .99 | ||
| MidAll | .97 | .91 | .96 | |
| Full | .92 | .90 | .93 | .95 |
Strong and significant correlations were observed across all methods (p<.001). In the dataset with outliers, the highest correlations were between F1OneThird and F1Three (M: r=.98; F: r=.98) and between F2OneThird and F2Three (M: r=.98; F: r=.98). The lowest, though still significant, correlations were between F1Mid and F1OneThird (M: r=.83; F: r=.82) and between F2Mid and F2OneThird (M: r=.85; F: r=.83).
In the dataset without outliers, the highest correlations were again between F1OneThird and F1Three (M: r=.99; F: r=.99) and between F2OneThird and F2Three (M: r=.99; F: r=.99). The lowest yet statistically meaningful correlations were found between F1Mid and F1OneThird in male speakers (r=.88), between F1OneThird and F1Full in female speakers (r=.90) and between F2Mid and F2OneThird in both male (r=.89) and female speakers (r=.87).
The correlation analysis indicates that all methods are strongly correlated, with only minimal differences among them. The strongest correlations were observed between OneThird and Three.
To examine potential differences in greater detail, we applied linear mixed-effects regression (lmer) models to the measurement of vowel formants for each vowel within sex, using R (R Core Team, 2025). In these models, F1Bark and F2Bark values were treated as dependent variables, measurement methods as fixed effects, and speakers and vowels as random effects.
In the male dataset with outliers in F1Bark, all significant differences were observed only when contrasts were made against Full (p=.000). In the female dataset, significant contrasts were identified for Mid–Full (p=.000), Three–Full (p=.022), and MidAll–Full (p=.002) in F1Bark.
In the male dataset with outliers in F2Bark, all significant differences were likewise observed only when contrasts were made against Full (Mid-Full: p=.000; OneThird-Full: p=.033; Three-Full: p=.002; MidAll-Full: p=.000). In the female dataset, all significant differences were observed exclusively when contrasts were made against Full (p=.000) in F2Bark. Tables 12 and 13 summarize the results for the datasets without outliers.
In the male dataset without outliers in F1Bark (Table 12), all significant differences were observed only when contrasts were made against Full (p=.000). In the female dataset, significant contrasts were identified for Mid–OneThird (p=.036), Mid–Full (p=.000), Three–Full (p=.008), and MidAll–Full (p=.000) in F1Bark.
In the male dataset without outliers, significant differences were observed for Mid–Full (p=.000) and MidAll–Full (p=.001) in F2Bark (Table 13). In the female dataset, significant contrasts were identified for Mid–Full (p=.000), OneThird–Full (p=.000), Three-Full (p=.000), and MidAll–Full (p=.000) in F2Bark.
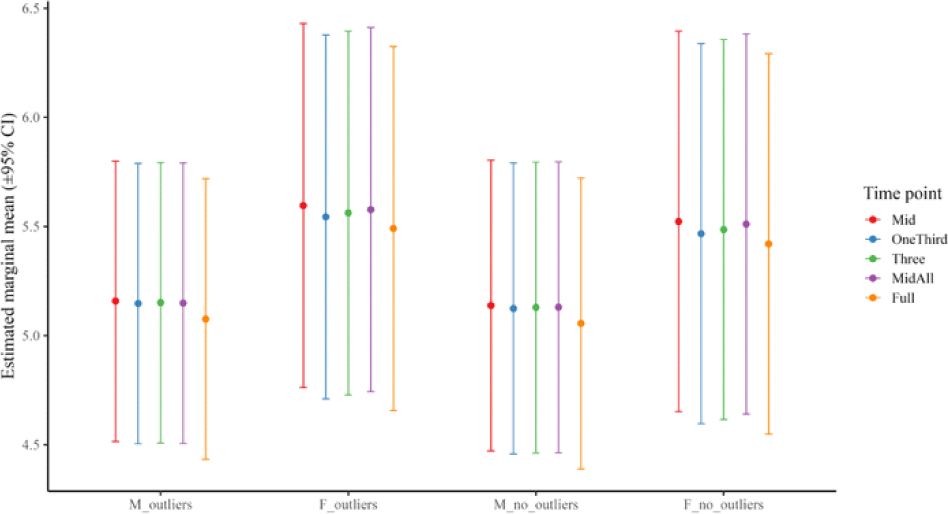
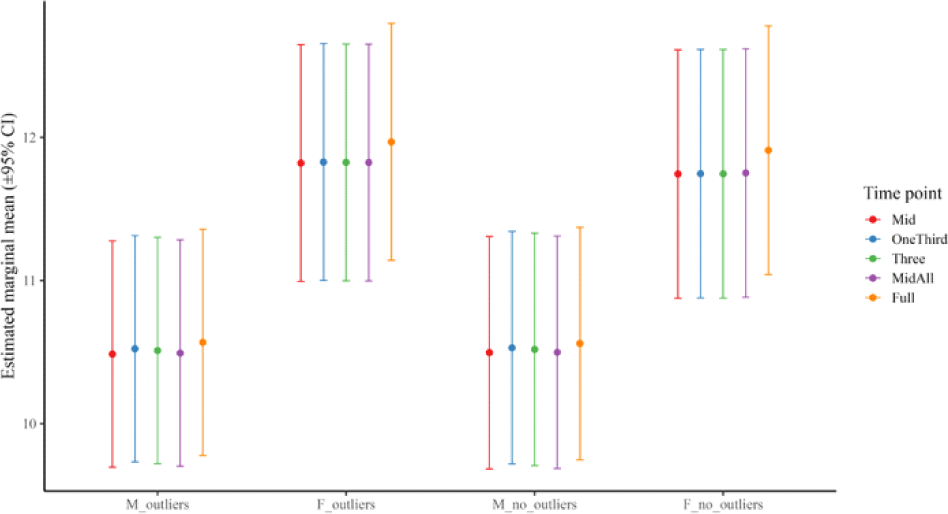
Figures 3 and 4 illustrate the global means of F1Bark and F2Bark by time point. The results indicate that the majority of significant contrasts involved comparisons with the Full method, and these contrasts were more pronounced in the female dataset in F2 Bark.
Using the outputs of F1Bark and F2Bark measurements, we also calculated the Euclidean distances of each vowel within the same speaker (Chung, 2024). Euclidean distance has been widely used to measure vowel dispersion from the centroid of the vowel system (Chung, 2024; Deterding, 1997; Harrington, 2010).
To accomplish this, the centroid of each vowel was first calculated for every speaker. The Euclidean distance from each individual vowel token to the centroid (the mean of F1Bark and F2Bark for that vowel) was then computed. Because these distances represent deviations from the group means, shorter distances indicate greater consistency in vowel production. Table 14 presents the global means of Euclidean distances for each method by sex.
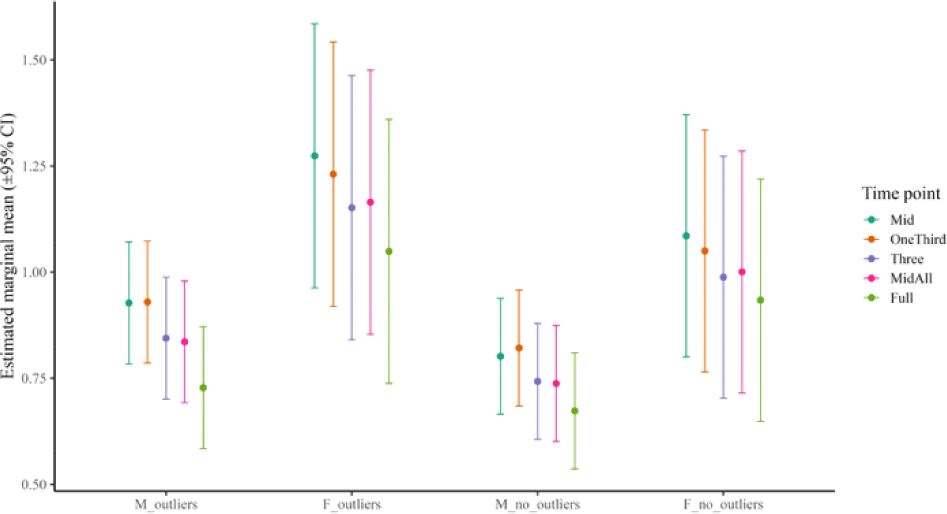
Across all datasets, the mean Euclidean distances were shortest in the Full method. Consistent with the results for F1Bark and F2Bark, the smallest standard deviations were consistently observed in the Full method. These findings support the view that the Full method is more reliable and robust than other methods, as it exhibits the least variability in measuring the same vowel. Furthermore, the boxplots in Figure 5 illustrate that the Full method generally yields shorter Euclidean distances than other methods.
We also examined the global correlations of Euclidean distances between methods. All methods were significantly (p<.001) and strongly correlated with one another (Tables 15 and 16).
| Mid | OneThird | Three | MidAll | |
|---|---|---|---|---|
| OneThird | .73 | |||
| Three | .81 | .94 | ||
| MidAll | .89 | .76 | .85 | |
| Full | .70 | .69 | .76 | .79 |
| Mid | OneThird | Three | MidAll | |
|---|---|---|---|---|
| OneThird | .76 | |||
| Three | .83 | .93 | ||
| MidAll | .88 | .76 | .85 | |
| Full | .63 | .64 | .69 | .71 |
In the dataset with outliers, the highest correlations were observed between OneThird and Three (M: r=.94; F: r=.94). The lowest correlations were found between OneThird and Full (r=.69) in the male dataset and between Mid and Full (r=.65) in the female dataset. In the dataset without outliers, the highest correlations were again observed between OneThird and Three (M: r=.94; F: r=.93), whereas the lowest were between Mid and Full (M: r=.70; F: r=.63).
Across both datasets, the Full method was distinct from the other methods in consistently showing lower correlations.
A further linear mixed-effects regression (lmer) analysis was conducted to assess differences in global mean Euclidean distances across methods. In this analysis, Euclidean distance served as the dependent variable, measurement methods as fixed effects, and speakers and vowels as random effects.
In the dataset with outliers, most contrasts were statistically significant, except for Mid–OneThird (M: p=.999; F: p=.170) and Three–MidAll (M: p=.944; F: p=.965). In the dataset without outliers (Table 17), a few contrasts were not significant, including Mid–OneThird (p=.233) and Three–MidAll (p=.986) in the male dataset, as well as Mid–OneThird (p=.119) and Three–MidAll (p=.921) in the female dataset. All other contrasts were highly significant.
Across both datasets, contrasts involving the Full method were most frequently significant (14 contrasts in total). The results further indicated that Euclidean distances were shorter in the dataset without outliers than in the dataset with outliers. Within the dataset without outliers, the Full method yielded the shortest Euclidean distances, whereas the longest distances were associated with either the OneThird or Mid method (male and female datasets without outliers; see Table 18). These findings suggest that shorter Euclidean distances reflect reduced variability in formant frequency measurements, while longer distances indicate greater variability.
| Sex | Order |
|---|---|
| M | Full < MidAll < Three < Mid < OneThird |
| F | Full < Three < MidAll < OneThird < Mid |
4. Discussion and Conclusion
Because the same vowels from the same speakers were analyzed in this study, the variations found are attributable solely to the different measurement methods, aside from inherent differences between vowels.
The analysis of F1Bark and F2Bark across measurement methods showed that all methods are highly correlated overall; however, mixed-effects models revealed systematic differences among them, most frequently in contrasts with the Full method. This suggests that, in principle, formant frequencies can be measured at any point within the vowel interval. Notably, the strongest correlations were observed between the OneThird and Three methods, indicating that whether formants are measured at a single one-third time point or averaged across three equally spaced points between one-third and two-thirds of the interval makes little difference.
However, when linear mixed-effects regression models were applied to assess differences across vowels within sex, the Full method consistently emerged as the most distinct. Contrasts involving the Full method showed stronger and more consistent differences than those involving other methods. These contrasts were more frequently significant in the female dataset for F2Bark. Because female speakers have shorter vocal tracts and higher fundamental frequencies, the harmonic spacing in their speech signal is wider. This reduces spectral resolution around formant peaks, especially in higher formants, and makes automatic tracking more sensitive to the precise temporal window used. Consequently, differences between single-point and multi-point methods are magnified in the female dataset, since averaging across multiple points helps stabilize estimates in contexts where sparse harmonic sampling can obscure or shift the apparent formant peak. This explains why contrasts between single- and multi-point methods were more prominent in the female dataset for F2Bark. These results indicate that although correlations between methods are generally strong, different approaches may still produce systematically different measurements.
The Euclidean distance analysis further confirmed the robustness of the Full method. Across all datasets, with and without outliers, measuring formants using all points throughout the vowel interval produced the shortest Euclidean distances, suggesting greater consistency. In contrast, the longest distances were observed when using only a single point, either at the midpoint or the one-third point.
Taken together, these results demonstrate that measuring vowel formant frequencies at multiple points, and especially using the Full method, is more effective and reliable than relying on a single measurement point. Earlier assumptions that formant values fluctuate excessively at the boundaries of the vowel interval due to coarticulatory effects were not supported here. Once vowels adjacent to /j/, /w/, /ɹ/,and /l/ were excluded and outliers removed, fluctuations were minimal. Under these conditions, averaging formant values across the entire vowel duration in 10-ms steps provided compact and precise measurements, superior to single-point approaches. Furthermore, advances in computational tools such as Praat scripts now make large-scale multi-point analysis both practical and efficient, a task that would have been far more challenging only a decade ago.
This study is not without limitations. First, the larger number of measurement points in the Full method may have contributed to shorter average Euclidean distances. Although the number of vowel tokens was the same across all methods, the number of measurement points differed substantially. For example, in a vowel lasting 100 ms, the Full method involves eleven measurement points, while the Mid and OneThird methods involve only one, and the Three method involves three. Second, the findings have not yet been tested on external corpora. Future research should replicate this procedure with American English or L2 English corpora to determine whether the robustness of multi-point formant measurement generalizes across languages and speaker populations. Third, we did not compare manual measurements of steady-state formant frequencies with the semi-automatic method used here, primarily due to the size of the corpus. Such a comparison would be valuable for assessing how closely automated methods align with manual measurements. Fourth, it may be inappropriate to generalize the results of this study to all vowels, as preprocessing excluded vowels following /j/, /w/, /ɹ/, as well as those preceding /l/, and vowels shorter than 40 ms. For very short vowels, measurement necessarily relies on a single point.
In conclusion, despite certain limitations, this study provides clear evidence that vowel formant measurements are more consistent and reliable when calculated from multiple points rather than from a single point, with the Full method proving the most robust. These findings not only refine methodological practices in acoustic phonetics but also highlight the advantages of modern computational tools in handling large-scale, fine-grained phonetic data.


