
 PDF Download
 PubReader
 Export Citation
 Email the Author
 Share Facebook
 Share Twitter
 Cited by 0 Article
 Metrics (View:145)







1. Introduction
Speech recognition in noisy environments is a challenge for both human listeners and automatic speech recognition (ASR) systems. Previous studies have measured these difficulties using aggregate performance measures such as word recognition accuracy or word error rate (WER; e.g., Derwing et al., 2000; Kim, 2025; Kim et al., 2024; Lecumberri et al., 2010; McCrocklin & Edalatishams, 2020; Munro, 1998). While these measures indicate how many errors occur (or how many words are recognized correctly), they do not show what types of errors are made or how those errors relate to the target words. For example, WER is calculated as the sum of insertion, deletion, and substitution errors, treating each error type equally. As a result, two recognition systems may obtain the same WER, while one primarily produces insertion errors and the other produces deletion errors (Mansfield et al., 2021). More importantly, two systems may produce the same number of substitution errors but differ in how closely their substituted responses resemble the target words (e.g., target cat→responses cap vs. pad).
This is particularly important when comparing human listeners and ASR systems. Even if the two types of listeners achieve identical WER (or word recognition accuracy), they may rely on fundamentally different recognition processes and produce qualitatively different error patterns. Examining the nature of the errors can therefore provide insights into the recognition processes that underlie successful and unsuccessful word recognition. To this end, the current study focuses on substitution errors and analyzes the relationships between errors and their corresponding target words in human listeners and ASR systems.
One way to examine substitution errors is to analyze the extent to which substituted responses of listeners preserve information from the target words. Two theoretically motivated dimensions are relevant in this regard: phonological similarity and semantic similarity. First, substitution errors may preserve the phonological information of the target words. According to the TRACE model (McClelland & Elman, 1986), speech input simultaneously activates phonologically similar lexical candidates and suppresses weaker ones as acoustic information is accumulated. For example, upon hearing the target word product, lexical candidates such as trot, possible, priest, progress, and produce may initially activate (although to different degrees); as more acoustic information comes in, the competitors drop out, with produce, differing only in the final few phonemes, remaining active the longest. Similarly, the Neighborhood Activation Model (Luce & Pisoni, 1998) proposes that lexical competition among phonological neighbors plays a crucial role in spoken word recognition. From this perspective, when acoustic information is limited (e.g., noisy listening environments), substituted responses may be phonologically unrelated to the target, because the speech signal provides insufficient evidence to activate phonologically similar candidates. However, as more acoustic information becomes available (e.g., less noisy environments), substituted responses are expected to be phonologically similar to the target words. Consistent with this prediction, substitution errors have been shown to cluster around words that are phonologically similar to the targets (Felty et al., 2013).
Second, substitution errors may preserve semantic information from the target words. According to the Spreading Activation Theory of Semantic Processing (Collins & Loftus, 1975), activation of a lexical item spreads to semantically related concepts. For instance, car is closely linked to truck and bus, which share the general category of vehicles, whereas its link to red is relatively more indirect, which could be mediated through the shared property of fire engine. Consequently, when there is sufficient acoustic information, semantically related words may also become active, potentially leading to substitution errors that are semantically related to the target. Note, however, that since the speech recognition task typically requires listeners to transcribe the input speech rather than to infer meaning from it, we predict that phonological similarity will play a greater role than semantic similarity in substitution errors.
Building on these two dimensions, the current study examines whether substitution errors produced by human listeners and an ASR system differ in the extent to which they preserve the phonological and semantic properties of the target words, and whether these patterns vary across different signal-to-noise ratios (SNRs). OpenAI’s Whisper is a large-scale ASR model trained on 680,000 hours of speech (Radford et al., 2023), which was found to achieve recognition performance that is comparable or even surpasses humans under noisy conditions (Kim, 2025; Kim et al., 2024; Patman & Chodroff, 2024). Despite showing high transcription accuracy, Kim et al. (2024) also found that under low SNR conditions (i.e., with more background noise), Whisper produced responses that were qualitatively different from those of human listeners. Similarly, Meyer et al. (2007) compared phoneme-level confusion patterns between human listeners and a Hidden Markov Model (HMM)-based ASR system after matching their overall recognition accuracy. They found that humans and the ASR system confused different phonemes, reflecting differences between the HMM’s statistical classification process of acoustic features and human auditory processing of those features. Together, these findings suggest that comparable recognition accuracy between humans and ASR systems does not imply similar error patterns or recognition processes.
Beyond differences between human listeners and ASR systems, the current study also examines whether phonological and semantic similarity between substitution errors and target words differs depending on the linguistic background of speakers—i.e., whether the speech is produced by first-language (L1) or second-language (L2) speakers. L1 listeners process L2 speech through their L1 phonological categories (Weber & Cutler, 2004). Because L2 speech often does not conform to the phonological patterns expected by L1 listeners (Flege, 1995), lexical competition during spoken word recognition may operate differently when processing L2 speech compared to L1 speech. For instance, according to the TRACE model and the Neighborhood Activation Model, increases in SNR are expected to activate phonologically similar competitors for L1 speech as more acoustic evidence becomes available. However, for L2 speech, increases in SNR may have a weaker effect, as the acoustic signal does not consistently map to L1 listeners’ phonological categories, thereby reducing the activation of phonologically related lexical competitors.
Thus, the phonological similarity of substitution errors is expected to change differently across SNRs for L1 and L2 speech. This pattern may also extend to ASR systems. For instance, Kim (2025) showed that, after controlling for recognition accuracy, Whisper showed disproportionately higher hallucination rates for L2 speech than for L1 speech, suggesting that the linguistic background of the speaker may influence ASR error patterns beyond overall recognition accuracy.
Although not specifically focused on substitution errors, previous studies have analyzed transcription errors produced by human listeners and ASR systems (e.g., Loweimi et al., 2023; Ruiz & Federico, 2015; Yoon et al., 2026; Wirth & Peinl, 2022). Most of these studies, however, relied on researcher-defined error categories. For example, some studies manually classified recognition errors into pre-defined categories such as minor errors (e.g., non context-breaking), major errors (e.g., context-breaking), homophones, among others (Wirth & Peinl, 2022). Others developed algorithmic procedures to assign errors to pre-defined error categories, such as phonetic (e.g., affricate, diphthong-related errors) or phonological errors (e.g., consonant simplification) (Loweimi et al., 2023; Ruiz & Federico, 2015; Yoon et al., 2026). Although these approaches differ in how the categories are assigned, they share a limitation: they classify recognition errors into discrete categories rather than quantifying how closely the errors resemble the targets along the theory-driven dimensions, such as phonological or semantic similarity. Moreover, manual classification is labor-intensive and difficult to apply to large-scale data.
To address these limitations, Felker et al. (2019) proposed an error analysis framework for human listener transcriptions that uses a continuous phonological similarity measure (computed automatically) and a semantic similarity measure (based on human ratings). In the context of ASR, recent studies have proposed fully automated, continuous similarity-based metrics as alternatives to WER. For example, Rugayan et al. (2022) measured utterance-level semantic similarity between ASR-generated transcriptions and reference texts for Norwegian speech, showing that the same WER can correspond to widely varying degrees of semantic similarity. Phukon et al. (2025) combined utterance-level phonetic, semantic similarity, and natural language inference scores that quantify semantic entailment between the reference and ASR transcript to assess the intelligibility of Wav2vec 2.0 and Whisper transcriptions of dysarthric and dysphonic speech. Together, these studies demonstrate that continuous similarity measures, rather than pre-defined, discrete error categories, can meaningfully capture the relationships between transcription errors and their targets. However, these approaches have either analyzed human transcription errors only, without comparison to those of ASR systems (Felker et al., 2019), or ASR transcriptions only, especially at the overall utterance level without analyzing individual substitution errors (Phukon et al., 2025; Rugayan et al., 2022). In addition, none of these studies has examined how error patterns change across SNRs. This leaves open the question of how substitution errors, captured through fully automated, continuous phonological and semantic similarity measures, differ between humans and ASR systems under varying listening conditions.
To address these gaps, the current study analyzes substitution errors made by human listeners and the Whisper ASR system, when transcribing speech produced by L1 and L2 speakers of English. Specifically, we examine the phonological and semantic similarity between substitution errors and the target words using continuous similarity measures and investigate how they vary across listening conditions (SNR), transcription systems (human vs. Whisper), and speaker language backgrounds (L1 vs. L2). We address the following research questions (RQs):
-
RQ1. As SNR increases, do substitution errors become more phonologically and/or semantically similar to the target words?
-
RQ2. Do SNR-related changes in the phonological and semantic similarity of substitution errors differ between human listeners and Whisper?
-
RQ3. Do SNR-related changes in the phonological and semantic similarity of substitution errors differ between L1 and L2 speech?
To answer these questions, we analyze an existing speech-in-noise recognition dataset reported by Kim (2025). The dataset includes target sentences and transcriptions produced by human listeners and Whisper across multiple SNR conditions for English sentences spoken by L1 and L2 talkers. Kim’s original analysis focused on overall recognition performance, showing that word recognition accuracy improved as SNR increased and was generally higher for L1 than for L2 speech. However, the original analysis did not examine the qualitative nature of transcription errors, particularly whether substitution errors preserve phonological or semantic information of the target words.
We predict that substitution errors would become more similar to their target words as SNR increases. As more acoustic information is available, substitution errors are expected to preserve more phonological and semantic information from the target words, with a stronger effect for phonological than semantic similarity. We also predict that humans and Whisper will differ in the extent to which phonological and semantic similarity increases with SNR, although we do not make a specific prediction about the direction of the difference. Finally, we predict that the increase in phonological and semantic similarity with SNR will be greater for L1 speech than for L2 speech.
Overall, this study will improve our understanding of transcription errors by examining how they vary across listening conditions, transcription systems, and speaker backgrounds. Unlike many previous error analysis studies, which relied on pre-defined error categories and which assigned errors to these categories manually or algorithmically, the current study characterizes substitution errors using continuous measures of phonological and semantic similarity. This approach provides a quantitative framework for understanding the nature of transcription errors in both human listeners and ASR systems.
2. Methods
The current study used the transcription data from Kim (2025). The data consisted of transcriptions produced by human listeners and the Whisper ASR system for L1 and L2 English speech from the ALLSSTAR corpus (Bradlow, n.d.). The speech materials were Hearing in Noise Test (HINT) sentences (Soli & Wong, 2008), which are short, simple English sentences widely used in audiology or clinical settings. Each talker produced 120 HINT sentences. The 120 recordings were divided into eight blocks, with each block mixed with speech-shaped noise at one of eight SNR conditions: -–4, –2, 0, 2, 4, 6, 8 dB, and Quiet (no noise). Speech from 25 L1 English talkers and 67 L2 English talkers (from diverse L1 backgrounds) was tested, and the transcriptions were produced by human listeners (10 listeners per talker) and by Whisper (large-v2). A total of 110,340 (humans) and 11,034 (Whisper) transcriptions were analyzed.
For each trial, we aligned the target sentence and the response sentence at the word-level and identified substitution, deletion, and insertion errors, using the WER calculation algorithm. As mentioned in the Introduction, we focused on substitution errors, because they allowed us to examine how target words are erroneously transcribed. Deletion and insertion errors were excluded, because it is difficult to calculate phonological and semantic similarity without a target-response word pair.
The unit of analysis was the content word substitution pair. When a sentence contained multiple substitution errors, each substitution pair was analyzed as a separate observation. For example, if the target sentence was “The girl is fixing her dress” and the response was “The girl is facing her desk,” this single sentence yielded two separate substitution pairs for analysis: (fixing→facing), and (dress→desk), each treated as an independent observation. Moreover, only cases in which both the reference word and the transcribed word were content words were included in the analysis; all other cases were excluded. To identify content words, part-of-speech (POS) tagging was performed at the sentence-level before extracting target-response word pairs. This approach was adopted because tagging words in isolation occasionally resulted in POS tagging errors (e.g., articles or common nouns being misclassified). Content word filtering was conducted using the spaCy library. Content words were defined as nouns, proper nouns, verbs, adjectives, and adverbs, corresponding to the spaCy POS tags NOUN, PROPN, VERB, ADJ, and ADV. A total of 50,565 content word substitution pairs (45,687 humans+4,878 Whisper) were identified for analysis.
Substitutions in which the reference word and transcribed word shared the lemma were classified as morphological errors (e.g., target walks→response walked). These errors were excluded from the analysis, because they reflect inflectional variation within the same lexical item rather than perceptual confusion between competing lexical candidates. Of the 50,565 pairs, 4,277 were morphological errors (8.46%), leaving 46,288 pairs for the analysis.
We calculated two similarity scores for each remaining substitution pair. First, for phonological similarity, we used the g2p_en package (Park & Kim, 2019; https://github.com/Kyubyong/g2p), which converts the reference word and transcribed word into phoneme sequences and calculates a similarity ratio between the two phoneme sequences (range: 0-–1). This ratio indicates how phonologically similar the two words are, with higher values indicating greater similarity between the target word and the transcribed word. Second, for semantic similarity, we used the all-MiniLM-L6-v2 Sentence Transformer model (Reimers & Gurevych, 2019; https://huggingface.co/sentence-transformers/all-MiniLM-L6-v2), which extracts word embeddings and calculates the cosine similarity between the reference word and the transcribed word (range: 0–1). This score indicates how semantically similar the two words are, with higher values reflecting greater semantic similarity. In the analysis, we used phonological similarity and semantic similarity as continuous measures and examined whether substitution errors become closer to the target words phonologically or semantically, as SNR, transcription system, and speaker background vary.
Given that SNR was treated as a numeric predictor in the statistical model, the Quiet SNR condition was excluded (2,471 out of 46,288 pairs, 5.34%), as it was difficult to assume a continuous numeric interval between the Quiet condition and the other SNR conditions (i.e., –4 to 8 dB). Thus, a total of 43,817 substitution pairs (out of 50,565 total pairs; 86.65%), excluding morphological errors and quiet conditions, were used in the regression analysis.
We examined how SNR, transcription system, and speaker background affect phonological and semantic similarity between transcribed and target words. Phonological similarity and semantic similarity were examined as separate outcome variables, and we thus fit two linear regression models.1 Each model included SNR, transcription system (human vs. Whisper), speaker group (L1 vs. L2), and all of their interactions as predictors. SNR was entered as a continuous predictor and centered (at 2 dB). Transcription system was sum-coded as –0.5 for human listeners and +0.5 for Whisper, and speaker group was sum-coded as –0.5 for L1 speech and +0.5 for L2 speech.
Because individual speakers produced multiple substitution pairs, clustered standard errors were calculated by speaker.2 Moreover, because both similarity scores were bounded variables ranged from 0 to 1, a fractional logit model using the same predictor structure was conducted as a robustness check.
3. Results
In general, as SNR increased, phonological similarity increased substantially, whereas semantic similarity showed a small increase. Figure 1A shows the mean phonological similarity and semantic similarity scores across SNRs by transcription system. Notably, humans and Whisper showed similar patterns across SNRs in both phonological and semantic similarity. Figure 1B presents the results separately for L1 and L2 speech and shows the same overall pattern: in both L1 and L2 speech, phonological and semantic similarity increased with SNR, the former showing a larger increase than the latter. It seems that the magnitude of increase in similarity was smaller for L2 speech than for L1 speech.
These descriptive patterns were examined in the statistical analyses. Complete coefficient estimates, standard errors, 95% confidence intervals, and p-values for the phonological and semantic similarity models are presented in Table 1. Here, we focus on the results that directly address our research questions: the main effect of SNR (RQ1), the interaction between SNR and transcription system (RQ2), and the interaction between SNR and speaker group (RQ3).
In the phonological similarity model, the main effect of SNR was significant, indicating that substitutions became phonologically more similar to the target as SNR increased. The interaction between SNR and transcription system was not significant, suggesting that there was no evidence that the increase in phonological similarity across SNRs differed between human listeners and Whisper. Phonological similarity descriptively showed a greater SNR-related increase for L1 than L2 speech, but the interaction between SNR and speaker group was not significant. This suggests that there was no significant evidence that the increase in phonological similarity across SNRs differed between L1 and L2 speech.
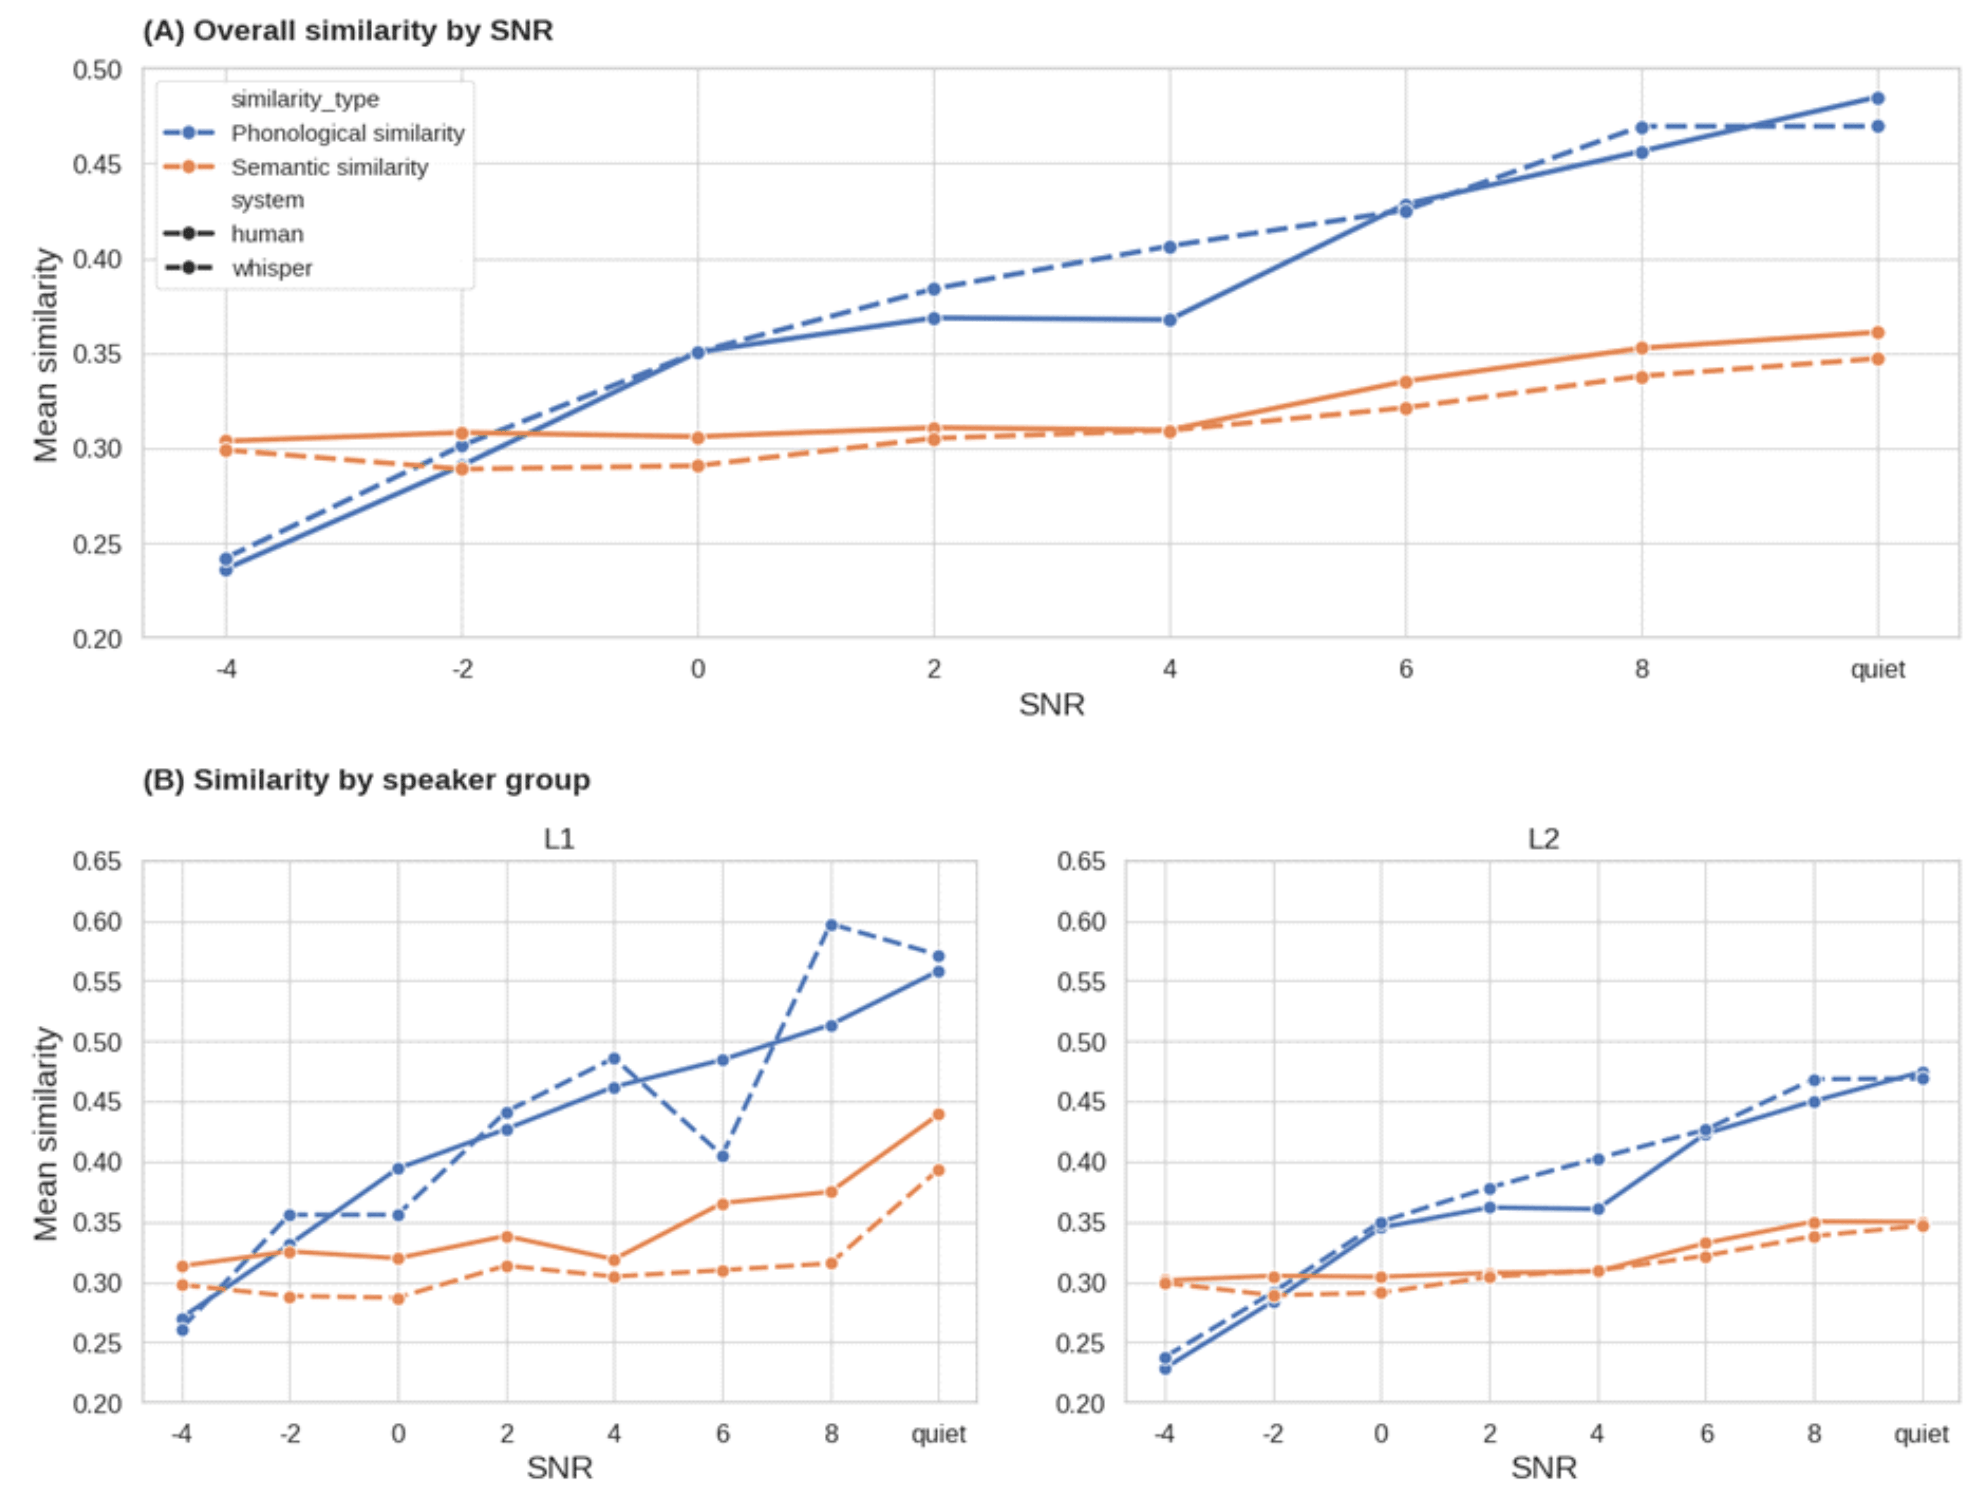
In the semantic similarity model, the main effect of SNR was also significant, indicating that substitutions became semantically more similar to the target as SNR increased. The interactions between SNR and transcription system and between SNR and speaker group were not significant. This indicates that there was no significant evidence that the increase in semantic similarity across SNRs differed between human listeners and Whisper or between L1 and L2 speech.
Across the two models, the estimated SNR slope was numerically smaller in the semantic similarity model (b=0.003) than in the phonological similarity model (b=0.021). This pattern suggests that, descriptively, substitution errors became more similar to the target in their phonological properties than in their semantic properties as SNR increased.
As a robustness check, separate fractional logit models were fitted for phonological similarity and semantic similarity using the same predictors as in the linear regression analyses. In both models, the main effect of SNR was significant, showing that both phonological similarity and semantic similarity significantly increased as SNR increased (phonological similarity: b=.091, SE=.005, p<.0001; semantic similarity: b=.013, SE=.002, p<.0001). The interaction between SNR and transcription system (phonological: p=.5107, semantic: p=.0867) as well as the interaction between SNR and speaker group (phonological: p=.1780, semantic: p=.7592) did not reach significance in the fractional logit models. These results were consistent with the primary analysis that both similarity measures increased with SNR, with no significant differences by transcription system or speaker group.
4. Exploratory Analysis: Classification of Substitution Errors
In the analysis above, phonological similarity and semantic similarity were treated as separate continuous dimensions for each substitution pair. This reflects our assumption that a single substitution error does not necessarily belong exclusively to a phonological error or a semantic error but can simultaneously exhibit phonological and semantic similarity to the target word. In this section, we explore whether these continuous similarity measures could be used to derive interpretable category labels for substitution errors. Unlike many previous studies, which started with pre-defined error categories and assigned transcription errors into those categories, we take the opposite approach by using continuous phonological and semantic similarity measures to derive interpretable category labels from the data.
We first examined the relationships between phonological similarity and semantic similarity at the substitution-pair level. Note that all substitution pairs (i.e., a total of 50,565 pairs), including morphological errors and those in the Quiet SNR condition, were included in this analysis, to provide a more complete characterization of the relationships between the two similarity measures. This differs from the main regression analysis above, which excluded morphological errors and the Quiet SNR condition. The main analysis was designed to examine phonological and semantic similarity specifically among lexical substitution errors and how they varied with SNR. Here, our goal is to characterize the full distribution of errors in the phonological-semantic similarity space and examine whether different regions of this space could be mapped onto interpretable error categories. The two similarity measures showed a moderate positive correlation (r=.454, p<.0001), suggesting that they capture related but distinct dimensions of substitution errors rather than a single underlying similarity dimension.
We then plotted each substitution pair in the phonological-semantic similarity space, as in Figure 2. The substitution pairs formed a continuum rather than clearly separated clusters. To further investigate what types of error patterns appeared under different combinations of phonological similarity and semantic similarity, we examined regions characterized by high values on both dimensions, low values on both dimensions, and a relatively high value on only one similarity dimension. This qualitative examination allowed us to assess whether continuous similarity scores could be translated into interpretable category labels.
First, in the high-high region (i.e., both phonological and semantic similarity are high), the majority of substitution pairs were found to be spelling variants. As expected, most of the morphological errors (e.g., target walks→response walked) fell under this region. Of the 50,565 substitution pairs included in this analysis, 57 cases (0.11%) had both phonological and semantic similarity higher than 0.9, of which 45 cases (79%) were morphological errors. The remaining 12 cases were spelling variants that were not identified as morphological errors under the lemma-based criterion (e.g., target children→response childrens). Thus, most cases in the high-high region involved morphological or orthographic variation.
Second, the low-low region (i.e., both phonological and semantic similarity are low) contained cases that could be interpreted as random-like guessing because the reference and response words were both phonologically and semantically unrelated. These were errors like: target clothes→response days, and target school→response open. We can indeed observe little phonological and semantic similarity between the target and response words in these examples. However, not all random-like guessing cases appeared in the low-low region. In other regions (e.g., mid-phonological similarity/low-semantic similarity region, low-phonological similarity/high-semantic similarity region), random-like guessing errors (e.g., target well→response rough) were still observed.
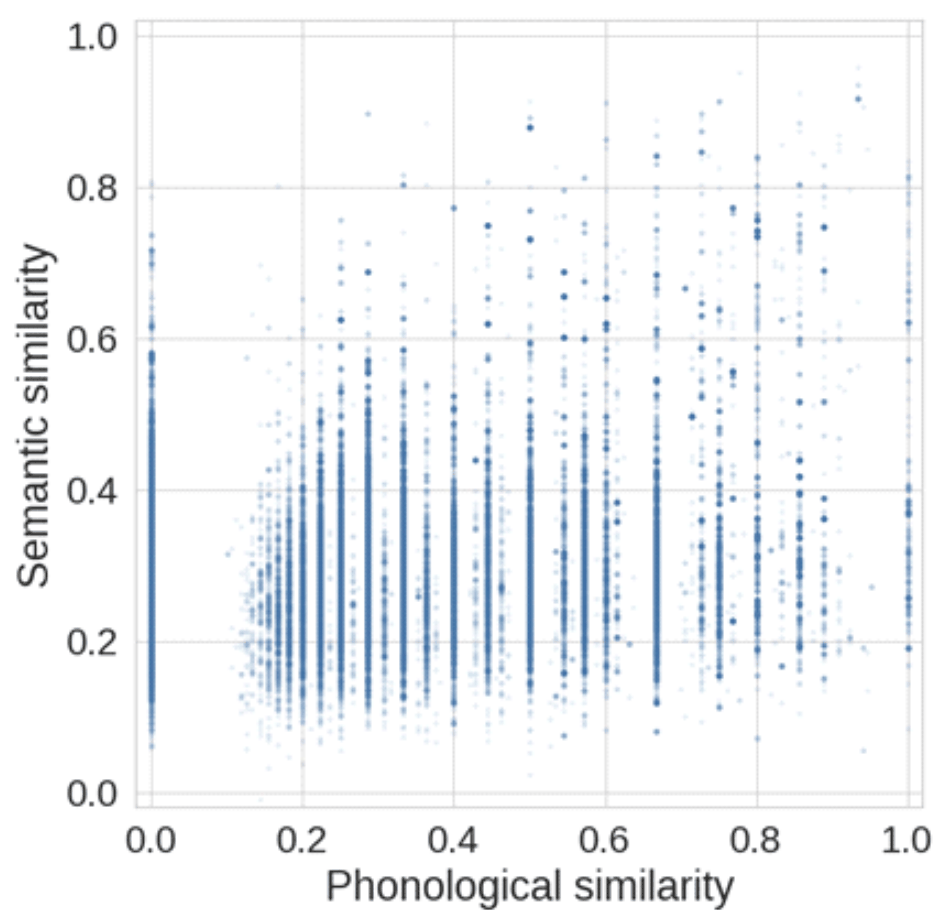
Lastly, the remaining substitution pairs showed heterogeneous patterns that could not be characterized as a single error type. Some pairs showed relatively greater semantic than phonological similarity (e.g., target mother→response daughter), whereas others showed relatively greater phonological than semantic similarity (e.g., target fell→response sell). Other pairs showed comparable values on both dimensions, without showing a clear dominance of either type of similarity (e.g. target bottles→response flowers).
This led us to conclude that a simple 2×2 high/low partition is not sufficient to produce stable and interpretable error categories. Instead, we developed four operational error categories based on the observed distribution of substitution errors: (i) morphological errors, (ii) semantic substitutions, (iii) phonetic confusions, and (iv) random-like guessing. As in the main analysis, (i) morphological errors were defined as substitution pairs in which the reference word and transcribed word shared the same lemma. (ii) Semantic substitutions were defined as cases that showed high semantic similarity but low phonological similarity (e.g., target big→response large). (iii) Phonetic confusions were defined as cases that showed high phonological similarity but low semantic similarity (e.g., target cat→response cap). (iv) Random-like guessing was defined as a residual category that consists of substitution pairs that did not belong to any of the three categories above.
Cases that belong to the category (i), in which the target and response share the lemma, were first filtered out as in the main analysis. Then, for categories (ii) and (iii), we set the following operational thresholds: semantic substitutions: phonological similarity <0.4 & semantic similarity >0.65; phonetic confusions: phonological similarity >0.7 & semantic similarity <0.5. These thresholds were selected heuristically through iterative partitioning and visual inspection of the phonological-semantic similarity space distribution, together with examination of substitution pair examples under different threshold values. They should therefore be regarded as operational criteria for the current exploratory analysis rather than as general thresholds applicable to other datasets. As mentioned above, the remaining errors were all categorized as (iv). Table 2 presents each category along with a representative example and its corresponding similarity values.
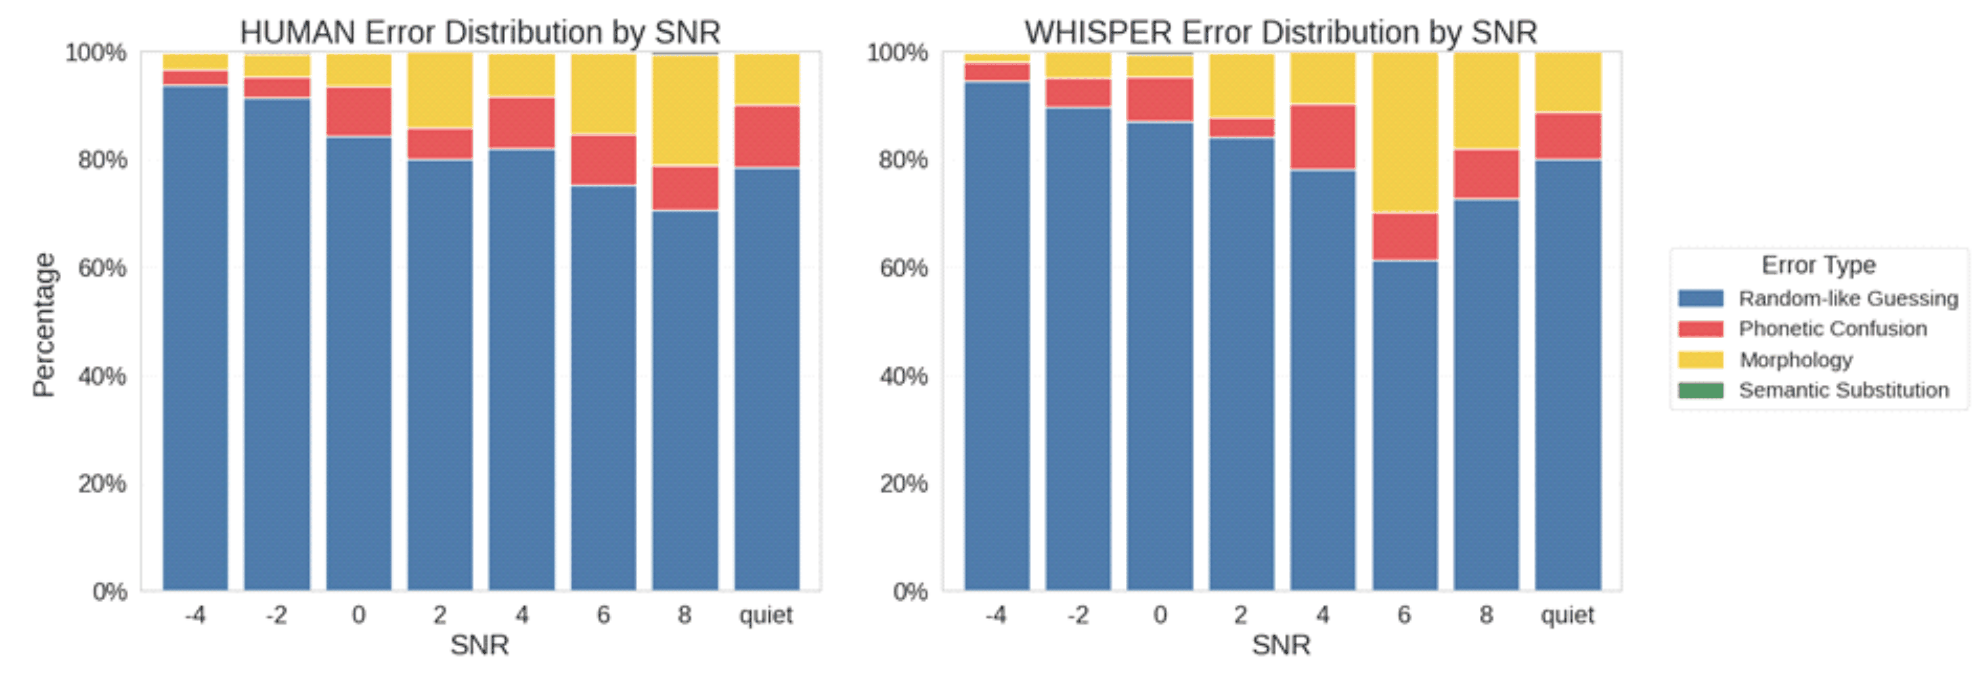
We then examined the proportions of these operational categories across SNRs by transcription system. Figure 3 shows the distribution of error categories across SNRs for human listeners and Whisper, collapsed across speaker groups. Note that we could not analyze L1 and L2 speech separately, because substitution errors were substantially less frequent in L1 than in L2 speech (especially at higher SNRs), resulting in insufficient observations for reliable comparisons.
In both systems, random-like guessing (blue) accounted for the largest proportion of substitution errors. Semantic substitutions (green) were rare across systems and SNR conditions. In general, as SNR increased, the proportion of random-like guessing decreased, whereas the combined proportion of phonetic confusions (red) and morphological errors (yellow) tended to increase. No clear or consistent patterns were observed for phonetic confusions and morphological errors when they were examined separately. These patterns were largely similar for human listeners (left panel) and Whisper (right panel). Note that the decrease in random-like guessing was not strictly monotonic, as both humans and Whisper showed a slight increase towards higher SNRs. This pattern may reflect the relatively small number of substitution errors under these high SNR listening conditions.
As noted above, random-like guessing represents a residual category which includes all substitution pairs that failed to meet the criteria for the other three error categories. Accordingly, errors in this category should not be interpreted as evidence that human listeners or Whisper generated responses through an actual random guessing process. Nevertheless, the decrease in random-like guessing accompanied by the increase in phonetic confusions and morphological errors as SNR increased suggests that substituted responses shifted from preserving little measurable similarity to the target word toward preserving more of its properties.
Although this pattern is consistent with the findings of the main analysis, the category-based analysis highlights a substantial methodological challenge. Assigning substitution errors to discrete categories required not only the selection of such categories as well as operational numerical thresholds, but also the treatment of heterogeneous and borderline cases that did not fit neatly into any single category. Consequently, pre-defined error categories may include errors that only partially conform to their defining characteristics, while other errors may not clearly belong to any of the available categories. This limitation further supports the use of continuous similarity measures for characterizing substitution errors.
5. Discussion
The current study examined the nature of transcription errors produced by human listeners and the Whisper ASR system during L1 and L2 English speech-in-noise recognition. Conventional approaches based on word recognition accuracy or WER can quantify how many errors occur but cannot reveal whether erroneous responses are phonologically related, semantically related, or unrelated to the target words. In this context, the present study analyzed content word substitution errors and calculated the phonological and semantic similarity between each error and its target word. We examined how these similarity measures vary as a function of listening condition (SNR), transcription system (human vs. Whisper), and speaker language background (L1 vs. L2). Specifically, we aimed to find out whether substitution errors at higher SNRs preserve stronger phonological or semantic relationships to the target words, and whether this pattern differs between the two transcription systems and between L1 vs. L2 speech.
First, we found that as SNR increased, substitution errors increasingly preserved the targets’ phonological information. Semantic similarity also increased with SNR, although the increase was descriptively smaller than that observed for phonological similarity. These patterns were observed in both the category-free analysis (Section 3) and the threshold-based categorical analysis (Section 4). In Section 4, we additionally found that morphological errors (i.e., errors and targets sharing the lemma) increased with SNR, while random-like guessing dominated in low-SNR conditions. Note that these patterns cannot be captured by just analyzing aggregate measures such as WER or word recognition accuracy, highlighting the importance of transcription error analysis.
The increase in phonological similarity between substitution errors and their target words with increasing SNR is consistent with several speech perception theories. According to the TRACE model (McClelland & Elman, 1986), speech perception is an interactive activation process in which activation and inhibition occur across the levels of features, phonemes, and words. The Neighborhood Activation Model (Luce & Pisoni, 1998) similarly proposes that phonologically similar words are activated and selected through lexical competition. From this perspective, we can predict that in lower SNR conditions, little acoustic information is available to strongly differentiate competing lexical candidates. As a result, multiple candidates may remain similarly activated, increasing the likelihood that the selected response bears little phonological relationship to the target. However, as SNR increases, phonological cues become more available, and this can strengthen the activation of phonologically similar competitors and suppress unrelated candidates. This indeed was confirmed in the present study.
In the current study, the increase in phonological similarity with SNR was descriptively larger than the increase in semantic similarity, suggesting that the substitution errors are shaped more strongly by phonological cues than by semantic relatedness in speech-in-noise recognition context. The strong influence of phonological cues may be related to the characteristics of the materials and task used in the current study. In Kim (2025), the speech materials consisted of short, relatively simple HINT sentences, and the task required listeners to identify and transcribe words they heard as accurately as possible. Under these conditions, available acoustic information is likely to guide responses more strongly than contextual or semantic inference, potentially contributing to the descriptively greater increase in phonological than semantic similarity. It thus remains an open question whether similar patterns would emerge with more complex speech materials or tasks that encourage deeper semantic processing.
The second finding is that human listeners and Whisper showed broadly similar patterns of errors across SNRs. This suggests that both systems were constrained by the availability of acoustic evidence in similar ways. Previous studies have shown that human listeners and ASR systems exhibit different phoneme confusion patterns even when they show a comparable level of accuracy (Meyer et al., 2007). Kim et al. (2024) also found higher hallucination rates in Whisper than humans in low SNR conditions, even though they showed similar levels of accuracy.
Unlike these studies, we found no significant interaction between SNR and transcription system for either phonological similarity or semantic similarity, suggesting no significant evidence that SNR-related changes in similarity differed between the two systems. This difference may be related to the different measures analyzed across studies. For example, hallucinations primarily manifest as insertion errors, which were excluded from the current study as we focused exclusively on substitution errors. Similarly, phoneme confusion patterns do not necessarily correspond to the phonological or semantic similarity between substituted words and their targets. Thus, the discrepancies between the present findings and previous studies may be attributable to differences in both the level of analysis (e.g., phoneme vs. word) and the properties of the errors examined (e.g., phoneme confusions, insertion errors, or continuous similarity measures).
Alternatively, the imbalance in the number of substitution pairs may have contributed to the non-significant interaction. In our data, the number of substitution pairs was substantially larger for human listeners (10 listeners per talker) than for Whisper (1 listener per talker). The smaller number of Whisper observations may therefore have limited our ability to detect differences between the two transcription systems in their SNR-related changes. Another possibility is that the two transcription systems have different sources of variability. The human data include variability across individual listeners, whereas the Whisper data do not have a corresponding listener-level factor. This means that listener-level variability could not be modeled in the same way for both systems (though see the Appendix).
Lastly, contrary to our prediction, the increase in phonological similarity across SNRs did not differ significantly between L1 and L2 speech. This suggests that increasing SNR provided useful phonological information for the recognition of both types of speech. Note that although L1 and L2 speech showed similar changes across SNRs, L1 and L2 speech differed in the level of phonological similarity, as indicated by the significant main effect of speaker group. That is, at the centered SNR level, substitution errors in L2 speech were less phonologically similar to the target words than those in L1 speech. This may be related to the acoustic-phonetic characteristics of L2 speech. L2 speech may not fully match the acoustic-phonetic patterns of the target language that are expected by L1 listeners (Flege, 1995; Weber & Cutler, 2004), and this can influence the degree to which acoustic information activates/suppresses the target word and its phonological competitors. As a result, the selected response may be less phonologically related to the target word when recognizing L2 speech. In sum, L1 and L2 speech differed in how phonologically similar their substitution errors were to the target words, but not in how phonological similarity changed across SNRs.
From a methodological standpoint, the current study shows that similarity-based algorithmic error analysis can capture meaningful patterns in speech-in-noise transcription data. Phonological similarity showed a relatively systematic increase with increasing SNR, and the similar patterns observed in the category-free analysis (Section 3) and the threshold-based categorical analysis (Section 4) increase confidence in the robustness of these findings. Furthermore, this analytical framework was applicable to both human and Whisper transcriptions, suggesting its potential as a more general error analysis tool that is not limited to a specific transcription system.
However, difficulties emerged when we attempted to map the continuous similarity measures onto discrete error categories. In particular, it was not always clear how, for example, morphological errors, spelling variants, and phonetic confusions should be distinguished if they are treated as separate error categories. Moreover, these categories are typically defined only after inspecting the data, creating the possibility that researcher judgment influences how the categories are constructed. Furthermore, even after the categories had been established, it remained challenging to determine appropriate numerical thresholds for assigning errors to those categories. In the current analysis, these thresholds were derived through exploratory inspection of the similarity distributions and error patterns in the data. Yet, even with these thresholds, some substitution errors fell near the category boundaries or did not fit neatly into any single category, highlighting the limitations of discretizing inherently continuous similarity measures.
We therefore believe that continuous similarity measures provide a useful way to characterize substitution errors without requiring researchers to pre-define categories or manually/algorithmically assign errors to them. We acknowledge that the phonological and semantic similarity metrics that we used in the current study may not fully capture all linguistically meaningful relationships between substitution errors and their target words. In addition, we also acknowledge that these similarity measures are applicable only to substitution errors and cannot be used to analyze other error types, such as deletions or insertions, which may also reflect important aspects of recognition process. Nevertheless, we believe that this framework provides an automated tool for characterizing transcription errors and should be interpreted alongside aggregate performance measures, such as word recognition accuracy or WER. Future studies are needed to better understand the relationships between continuous similarity measures and discrete, linguistically meaningful error categories. In this sense, a hybrid approach, in which an automatic analysis identifies general patterns, while detailed inspection clarifies the linguistic properties of individual cases, may be a practical alternative.
6. Conclusion
The current study algorithmically analyzed transcription errors produced during speech-in-noise recognition using continuous measures of phonological similarity and semantic similarity and examined how the error patterns differ across SNRs, transcription systems, and speaker language backgrounds. The results showed that, as SNR increased, substitution errors preserved more of the target words’ phonological and semantic properties, with the estimated effect of SNR on phonological similarity being descriptively larger than that on semantic similarity. These patterns could not be captured by just analyzing aggregate measures such as word recognition accuracy or WER. Regarding Whisper vs. human listeners and L1 vs. L2 speech, we found no significant evidence that the estimated SNR-related slopes differed between the two systems and speaker group (though see the Appendix). The exploratory analysis, which classified errors into several error categories, further revealed that as SNR increased, substitution errors shifted from random-like guessing to morphological errors or errors that preserved phonological properties of the targets.
Methodologically, the continuous, similarity-based approach was effective in capturing relationships between substitution errors and their target words in large-scale data. However, mapping these continuous similarity measures onto discrete error categories proved challenging. This highlights an advantage of the similarity-based algorithmic approach, while also suggesting that a combination of this analysis and categorical analysis based on manual inspection may be the most practical approach for comprehensive error analysis.
The contribution of the current study can be summarized in two ways. First, the current study proposed an analytical framework that quantifies the characteristics of substitution errors using continuous measures of phonological and semantic similarity, moving beyond conventional approaches that simply count the number of errors or assign them to discrete, pre-defined error categories. This framework was applicable to both human listeners and ASR systems, suggesting its potential as a general error assessment tool. Second, by relating changes in error patterns to speech perception theories such as the TRACE model, the Neighborhood Activation Model, and the Spreading Activation Theory, the current study provides a theoretically-grounded framework for interpreting transcription errors. Moving beyond WER- or accuracy-centered evaluation and systematically examining the nature of transcription errors is an important direction for improving our understanding of both human and machine speech recognition. Applying this framework to different languages, ASR architectures, and speech types may contribute to the development of more informative methods for speech recognition error analysis.


