
 PDF Download
 PubReader
 Export Citation
 Email the Author
 Share Facebook
 Share Twitter
 Cited by 0 Article
 Metrics (View:120)







1. Introduction
Oral reading fluency (ORF) refers to the ability to read text quickly, accurately, and with appropriate phrasing and expression, while comprehending its meaning (Rasinski, 2004; Valencia et al., 2010). It comprises three components: accuracy, automaticity, and prosody, which interact complementarily to facilitate learners’ reading comprehension (Daane et al., 2005; Rasinski, 2004). According to automaticity theory, as word recognition becomes automated, cognitive resources can be allocated to comprehension processes (LaBerge & Samuels, 1974). In this regard, automaticity is closely associated with reading speed (Fuchs et al., 2001). Moreover, oral reading provides opportunities to observe and evaluate learners’ reading processes, making it particularly useful in classroom contexts (Hasbrouck & Tindal, 2017; Jeon & Yamashita, 2022).
The assessment of ORF has traditionally relied on words correct per minute (WCPM), a measure developed within the curriculum-based measurement (CBM) system for efficiently monitoring American elementary school learners’ reading progress (Deno & Marston, 2006; Kuhn et al., 2010). However, WCPM, which measures word-level accuracy and reading speed, provides limited insight into prosodic aspects related to reading comprehension (Kuhn & Stahl, 2003). This limitation highlights the need to assess prosody separately from accuracy and reading speed (Valencia et al., 2010). One of the most representative measures for prosodic evaluation is the fluency scale developed by the National Assessment of Educational Progress (NAEP), which uses a four-point rating system to evaluate three dimensions of oral reading: phrasing, adherence to the author’s syntax, and expressiveness (Pinnell et al., 1995). In addition, Zutell & Rasinski (1991) proposed the Multidimensional Fluency Scale, which assesses fluency based on 4 constructs: expression and volume, phrasing, smoothness, and pace. Although these scales are commonly used, their reliance on human judgment makes them difficult to apply consistently in large-scale assessments.
To address this limitation and reduce teachers’ scoring demands, Bolaños et al. (2011) proposed the FLuent Oral Reading Assessment (FLORA) system, which automatically computes WCPM. Building on FLORA, Bolaños et al. (2013) used its lexical and prosodic features to automate expressive reading assessment according to the NAEP scale, thereby extending automated ORF assessment beyond WCPM to include prosodic aspects of oral reading. However, FLORA does not include measures of reading comprehension. Subsequently, Microsoft introduced “Reading Progress” in Microsoft Teams, which automatically reports indicators such as Correct words per minute (WPM), accuracy, and expression, and enables the assessment of reading comprehension (Microsoft, 2026). Utilizing acoustic feature extraction software such as openSMILE, Kim et al. (2021) identified 72 speech features that best predicted students’ WCPM, while Wang et al. (2024) determined a set of nine optimal features that most accurately predicted human ratings based on the NAEP scale. Although these automated approaches have successfully predicted WCPM or human-rated NAEP fluency scores, they remain limited in capturing only certain aspects of overall ORF performance.
In the EFL context, early studies on ORF excluded prosodic evaluation due to its subjectivity, focused on the relationship between reading speed, accuracy, and reading comprehension. These studies reported that reading speed and reading comprehension are not entirely independent, but their correlation is weak (Fujita & Yamashita, 2014; Jeon, 2012). More recent research, however, incorporating prosody scores into the analysis, has shown that prosody can serve as a key predictor of learners’ reading comprehension performance (Hannah et al., 2025; Hwang, 2025). These findings suggest the importance of including prosody in ORF assessment in the EFL context as well.
Recent studies in the EFL context have aimed to quantify prosodic and fluency-related aspects of ORF using temporal and acoustic measures. Commonly used quantitative indices that capture temporal aspects of foreign language learners' fluency include WPM and syllables per second (SPS); Hieke, 1985; Lennon, 1990). It has been reported that higher proficiency is generally associated with faster WPM (Lennon, 1990), while SPS has been shown to distinguish intermediate and advanced learners more precisely (Hieke, 1985). Examining both temporal and prosodic features in the English oral reading of Korean middle school EFL learners, Kim (2022) reported that SPS and F0 range were identified as the variables that best explained fluency levels, whereas rhythm, measured using the normalized Pairwise Variability Index (nPVI), did not show significant explanatory power. Focusing more specifically on prosody, Kallio (2024) compared data from English learners of different first-language backgrounds who speak typologically similar languages to English and identified nPVI and F0_range as key predictors of prosodic proficiency.
Despite these advancements, commercially available automated ORF assessment systems remain limited in their applicability to diverse EFL contexts, particularly due to a lack of alignment with local curricular standards. To address the limitations identified above, the present study aims to identify speech and reading comprehension measures that can inform future automation. Specifically, as a foundational study toward automated ORF assessment in EFL contexts, we propose and validate predictive models that estimate teacher-rated ORF scores using speech measures from oral reading recordings and comprehension data from Korean middle school EFL learners. The speech measures were manually derived to provide reference values for comparison with future automated extraction methods. Accordingly, this study (1) examines the relationship between ORF scores and reading comprehension measures; (2) investigates differences in speech measures across ORF proficiency levels; and (3) evaluates predictive models for estimating ORF scores using speech and reading comprehension measures.
2. Methods
The recording and the two sets of reading comprehension tests were conducted using Microsoft Teams. The Reading Progress function automatically provided feedback such as Correct WPM, accuracy, detailed error types, and monotone score, which were collected as reference data. However, they were excluded from the present analysis due to their low reliability as evaluated by the teachers.
Participants were recruited from one middle school in Seoul, Korea. Data collection was conducted over two class sessions, and students with incomplete oral reading or reading comprehension data due to absence from either session were excluded from the final analysis. A total of 237 Korean middle school students participated in a one-minute oral reading recording session and took two reading comprehension tests. The participants’ mean age was 14.01 years (SD=0.87; range=13–15) including 116 male and 121 female students.
A reading text for assessing ORF was selected from passages in first-grade middle school English textbooks of the revised 2015 Korean national curriculum. Some proper nouns and expressions were modified in order to reduce lexical effects and the passage length was adjusted to fit a one-minute oral reading task. The final text was a narrative passage consisting of 127 words and 166 syllables, with a Flesch–Kincaid Grade Level (FKGL) readability index of 3.11.
The recordings were conducted in a designated classroom, where students recorded individually in soundproof booths using iPads. Speech recordings were collected using a headset microphone (Corsair HS65 Surround, Corsair, Milpitas, CA, USA). The recorded audio files were saved in either WEBM or MP4 format, and all files were converted to WAV format (16 kHz, mono, 16-bit PCM) using FFmpeg (version 4.4.2) in the Google Colab environment.
An ORF scoring rubric was devised to rate students’ oral reading performance on a five-point scale. It was designed on the basis of existing ORF scoring rubrics (Council of Europe, 2020; Han et al., 2024; Pinnell et al., 1995; Zutell & Rasinski, 1991), taking into account the achievement standards of the national curriculum (Ministry of Education, 2022). Two constructs were evaluated: segmental accuracy and prosody. In this study, segmental accuracy focuses on the detailed assessment of speech segment clarity (Han et al., 2024). Although this construct is not typically included in native-speaker fluency assessments, it is particularly relevant in EFL oral reading contexts. Table 1 provides the ORF scoring rubric (Jo et al., 2025).
Four middle school English teachers participated as raters, and rater training was held prior to scoring. A partially crossed rating design (Eckes, 2015) was applied so that each learner’s recording was randomly assigned to two raters, and all ratings were conducted independently.
To examine the reliability of scores assigned by multiple raters, Krippendorff’s alpha (K-α) was employed. To yield adjusted average measures for use as the ORF scores, many-facet Rasch measurement (MFRM) was employed. A Rasch model including (a) examinee, (b) rater, and (c) criterion as facets was constructed. The MFRM analysis was conducted by Minifac64 (Facets 64-bit Student/Evaluation, version 4.2.2; Linacre, 2024).
To assess reading comprehension of the given ORF reading text, 4 questions (RC4) were developed, encompassing main idea, detail, and inference types. Each student answered the questions just after each recording session. The texts used to assess silent reading comprehension (RC14) were also selected from first-grade middle school English textbooks. Following the format of the RC4 question design, a total of 14 items were developed. The reading comprehension items were developed by the research team specifically for this study and subsequently reviewed by middle school English teachers to evaluate their appropriateness for middle school learners. The review focused on text difficulty, the wording of question stems, passages, and answer options, and the identification of potential item errors. The items were revised based on the reviewers’ feedback. The genre, number of items, word count, and FKGL readability index for each RC text after revisions, are presented in Table 2. RC4 (maximum score=4) and RC14 (maximum score=14) were collected as reading comprehension measures. Sample items are provided in the Appendix.
| Variables | RC4 | RC14_1 | RC14_2 | RC14_3 |
|---|---|---|---|---|
| genre | narrative | expository | expository | narrative |
| items | 4 | 5 | 5 | 4 |
| word count | 127 | 234 | 177 | 255 |
| FKGL | 3.11 | 2.47 | 2.54 | 3.38 |
In this study, we use six speech measures, grouped into four categories: one speed measure, three combined accuracy + speed measures, one accuracy measure, and one acoustic measure, as follows.
Speed measure
-
WPM: total number of words read, excluding omissions but including errors, within one minute (Valencia et al., 2010).
Accuracy + Speed measures
-
WCPM: number of correctly read words, excluding both omitted and error words, within one minute (Valencia et al., 2010).
-
Syllables correct per minute (SCPM): the number of correctly read syllables per minute, during the 60-second reading task.
-
Syllables correct per second (SCPS): the number of correctly read syllables divided by each learner’s actual speaking duration (s). SCPS was calculated as follows:
Accuracy measure
-
Accuracy: ratio of WCPM to WPM (Hwang, 2025)
Acoustic measure
WPM and WCPM were calculated manually by three researchers including an author of this paper through joint listening and word-by-word annotation of errors in learners’ oral readings. As word-level units have variations in word length (James, 1956), the current study proposed SCPM and SCPS to refine the WCPM metric with syllable-level precision. Specifically, SCPM was defined by applying the WCPM framework to syllables rather than words. Because the reading task was limited to 60 seconds, the number of correctly read syllables during the task directly represented the number of correct syllables per minute. SCPS was computed as described earlier, based on the concept of SPS (Hieke, 1985), incorporating an accuracy component by calculating the number of correctly produced SPS to more accurately capture learners’ fluency patterns. Actual speaking duration was measured using Praat (Boersma & Weenink, 2025) from the manually identified onset to the offset of each learner’s oral reading. This duration could vary due to delayed onset or completion before the 60-second limit. Although SCPM and SCPS are both based on the number of correctly read syllables, they differ in how speaking time is incorporated. Learners who correctly produce the same number of syllables could have the same SCPM but different SCPS values if their actual speaking durations differ.
In terms of prosodic features, F0 range was included based on previous studies identifying it as an important acoustic measure associated with L2 fluency and prosodic proficiency (Kallio, 2024; Kim, 2022). F0-related parameters, including F0 mean, F0 minimum, and F0 maximum values extracted across the entire utterance using Praat (Boersma & Weenink, 2025). The pitch floor and ceiling were set to 75 and 500 Hz, respectively, and the time step was set to the automatic default. No additional trimming or exclusion of anomalous F0 values was applied. To account for anatomical differences between male and female speakers, semitone conversion was applied (Zhang, 2018). F0 values were converted to semitones using the following equation, where REF represents each speaker’s mean F0:
All statistical analyses were conducted using RStudio (version 2025.09.2+418; RStudio Team, 2025) running on R (version 4.5.1) (R Core Team, 2025). To examine associations between ORF scores and reading comprehension measures, we conducted Pearson correlation analysis. To support the use of speech measures as predictors of ORF scores, we investigated whether they demonstrated significant differences across levels using the Kruskal–Wallis test. Effect sizes (ε²) and Bonferroni-adjusted Dunn’s post-hoc tests were also reported.
To predict ORF scores, we used Elastic Net regularized regression (Zou & Hastie, 2005). Models were fitted using the glmnet package (Friedman et al., 2010), and all predictor variables were standardized (centered and scaled) to eliminate differences in measurement scale. Hyperparameter tuning for the Elastic Net model was performed via repeated 10-fold cross-validation (10 folds × 3 repeats) implemented in the caret package (Kuhn, 2008). The tuning grid included α values from 0 to 1 in increments of 0.1 and 50 λ values logarithmically spaced from 0.001 to 10. The optimal combination of α and λ was selected based on the lowest cross-validated root mean squared error (RMSE). The same cross-validation folds were used across all models to ensure fair comparison. Differences in RMSE across models were examined using Friedman tests (Friedman, 1937), followed by Nemenyi post-hoc tests (Nemenyi, 1963).
3. Results
Table 3 presents descriptive statistics for ORF scores and RC4, RC14 measures across levels, reported as means (M) and SD. Segmental accuracy (SEG_avg) and prosody (PRO_avg) scores are represented as the average of the raw ratings.
The K-α values for the segmental accuracy and prosody categories were 0.85 and 0.71, respectively, indicating high and moderate levels of reliability (Hayes & Krippendorff, 2007). Before interpreting the MFRM results, the assumptions of unidimensionality and overall model fit were examined, and both were found to be acceptable. Infit mean-square (MnSq) and Outfit MnSq values were examined to examine rater consistency within the MFRM framework. The resulting MFRM fit statistics for each rater are presented in Table 4. A criterion range of 0.50 to 1.50 was adopted, and all values were found to fall within this acceptable range (Linacre, 2020).
| Rater | Measure | Infit | Outfit | ||
|---|---|---|---|---|---|
| MnSq | Zstd | Mnsq | Zstd | ||
| R2 | 0.86 | 0.85 | –1.6 | 0.85 | –1.5 |
| R4 | 0.47 | 1.05 | 0.4 | 1.13 | 1.1 |
| R1 | –0.62 | 0.81 | –1.7 | 0.81 | –1.4 |
| R3 | –0.71 | 1.18 | 1.7 | 1.15 | 1.2 |
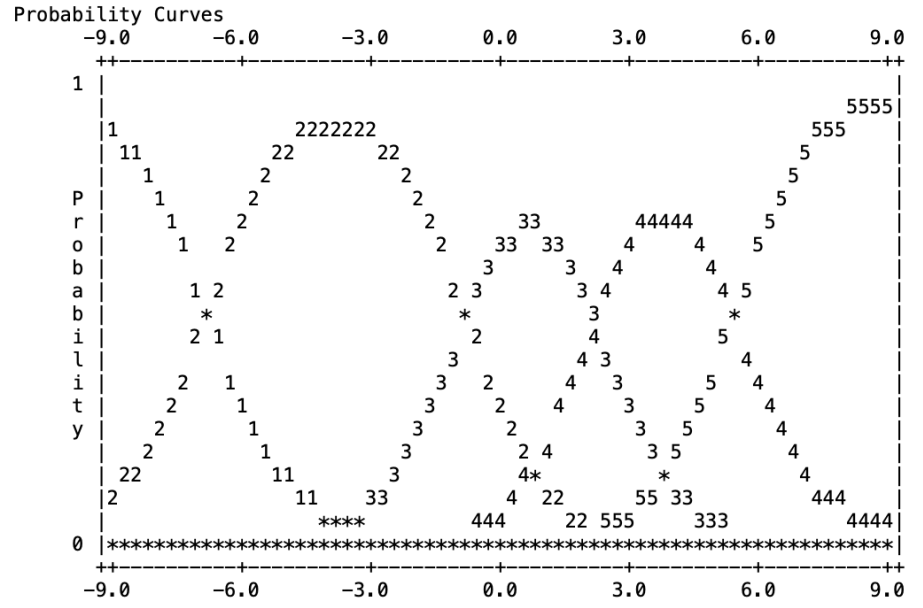
Figure 1 presents the MFRM category probability curves, which illustrate the functioning of the five-point rating scale. The peak of each curve represents the ability level at which a particular score category is most likely to be assigned. The five score categories were sequentially ordered along the ability continuum, with higher score categories becoming more probable as ability increased. Furthermore, no category disordering was observed, indicating that the five-point rating scale functioned in an ordered manner.
The mean adjusted ORF score was 3.61 (SD=1.19; range=1.05–4.95). To classify learners into proficiency levels, the one-point interval structure of the 1–5 scoring rubric used in this study was maintained. This approach also took into account that the rubric was developed based on the middle school national curriculum and that the lowest score specified in the curriculum is 1. Due to the MFRM score adjustment, however, no student reached the maximum adjusted score of 5, even when full marks were given for both segmental accuracy and prosody in the raw ratings. Accordingly, scores of 4.0 or higher were classified as Level A, scores from 3.0 to below 4.0 as Level B, scores from 2.0 to below 3.0 as Level C, and scores from 1.0 to below 2.0 as Level D.
Figure 2 illustrates the correlations among ORF scores, and RC scores. ORF scores showed moderate correlations with RC4 (r=.47) and stronger correlations with RC14 (r=.65). Both segmental accuracy and prosody showed moderate correlations with RC4 (r=.46 and .47, respectively) and stronger correlations with RC14 (r=.62 and .65, respectively). RC4 and RC14 showed a moderate correlation (r=.45).
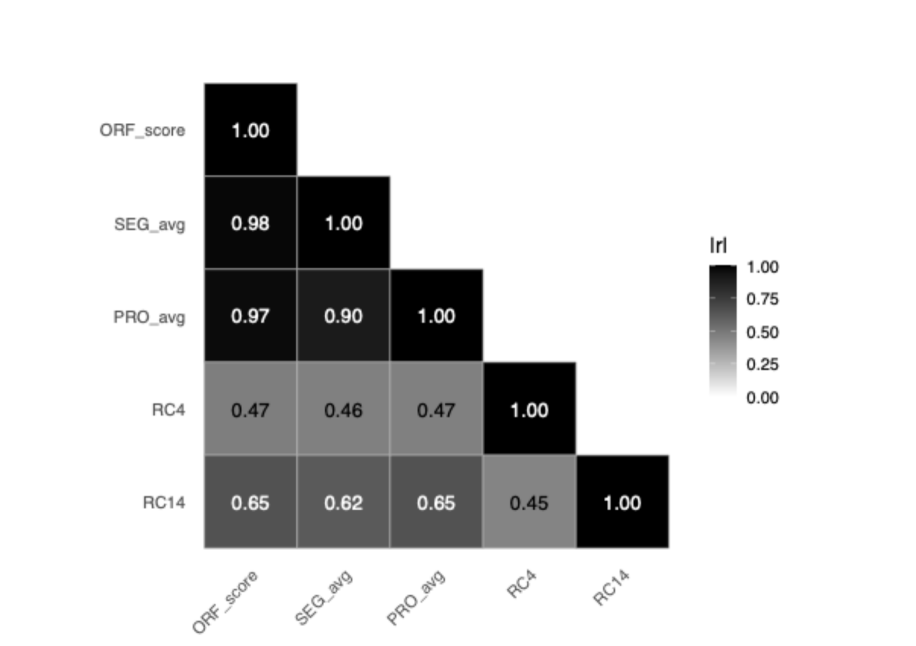
Figure 3 illustrates the correlations among ORF scores, and speech measures including WPM, WCPM, SCPM, SCPS, Accuracy, F0_range. ORF scores were most strongly correlated with SCPM (r=.92), whereas F0_range showed negligible correlation with ORF scores (r=.07). Extremely high intercorrelations were observed among speed related measures (r=.96–.99), indicating substantial multicollinearity.
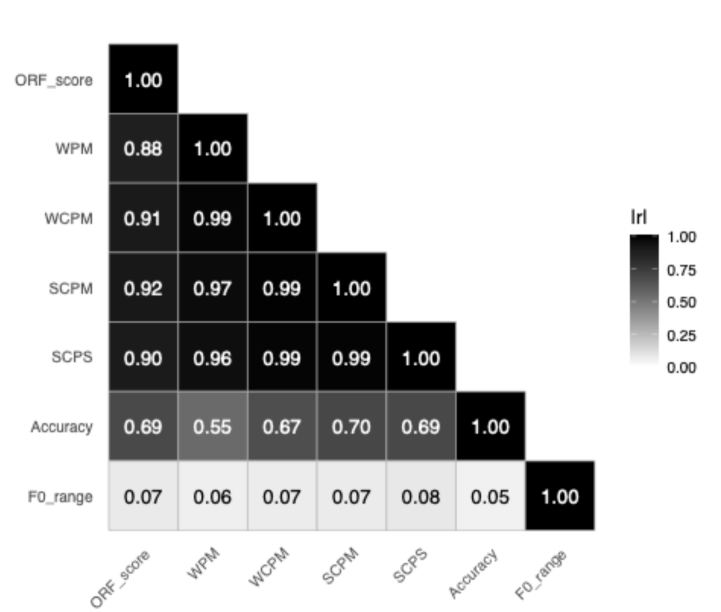
Table 5 presents descriptive statistics for speech measures across ORF levels, including WPM, WCPM, SCPM, SCPS, Accuracy, F0_range, reported as M and SD. Sample sizes for each level are also reported in the table. The Kruskal–Wallis test revealed differences across levels for WPM, WCPM, SCPM, SCPS, and Accuracy (all p<.05; ε²=.43–.7). Higher ORF proficiency was consistently associated with higher values across all measures showing significant differences, with large effect sizes indicating substantial differences among proficiency levels. In contrast, F0_range showed no significant differences across levels (p≥.05; ε²=.02). Dunn’s post-hoc tests revealed that for WPM, WCPM, SCPM, and SCPS, most pairwise comparisons were significant after Bonferroni adjustment, except for the comparison between levels C and D (adjusted p-values≥.05).
Among the variables, accuracy showed a distinct post-hoc pattern. For accuracy, no significant differences were observed between proficiency levels B and D or between C and D after Bonferroni adjustment (adjusted p-values≥.05).
In this study, four Elastic Net prediction models (Models A–D) were compared according to the composition of the input variables. Each model was defined based on the set of predictors included, as follows.
-
Model A: included only speech measures extracted from the oral reading recordings, namely WPM, WCPM, SCPM, SCPS, Accuracy, and F0_range.
-
Model B: extended Model A by adding the RC4 score.
-
Model C: extended Model A by adding the RC14 score.
-
Model D: included all measures, resulting in a total of eight predictors.
Table 6 reports hyperparameters (α and λ) selected from10-fold cross-validation performance metrics (RMSE±SD and R²) for each model. The RMSE and R² values represent the mean performance across 10-fold cross-validation repeated three times at the optimal hyperparameter settings.
| Model | α | λ | RMSE±SD | R² |
|---|---|---|---|---|
| Model A | 0.1 | 0.001 | 0.459±0.075 | 0.848 |
| Model B | 0.1 | 0.001 | 0.460±0.077 | 0.848 |
| Model C | 0.1 | 0.001 | 0.445±0.074 | 0.858 |
| Model D | 0.1 | 0.001 | 0.446±0.074 | 0.857 |
Model C exhibited the best predictive performance. The Friedman test revealed a statistically significant difference in RMSE across the four models [χ²(3)=27.64, p<.001]. Nemenyi post-hoc comparisons further showed that Model C significantly outperformed Models A, B, and D (all p<.05), whereas no significant differences were found among Models A, B, and D.
| Selected predictors | Stdβ |
|---|---|
| SCPM | 1.10 |
| WCPM | –0.47 |
| WPM | 0.35 |
| SCPS | –0.23 |
| RC14 | 0.13 |
| Accuracy | 0.12 |
| F0_range | 0.02 |
Table 7 presents the standardized regression coefficients (Stdβ) of the predictors selected in Model C. All candidate predictors were retained in the model. Based on the absolute values of the standardized coefficients, SCPM showed the largest absolute standardized coefficient (Stdβ=1.10), followed by WCPM (Stdβ=−0.47) and WPM (Stdβ=0.35). However, because several predictors captured overlapping aspects of reading speed and accuracy, the magnitudes and signs of individual coefficients should be interpreted as conditional associations after accounting for the other predictors in the model, rather than as simple relationships with ORF scores.
4. Discussion
This study examined whether ORF scores, defined as an integrated construct of segmental accuracy and prosody, can be predicted using speech and reading comprehension measures from Korean middle school EFL learners. The results showed that ORF scores were significantly correlated with both passage-based (RC4) and silent reading comprehension measures (RC14), indicating that higher ORF proficiency is associated with stronger reading comprehension abilities. The observed correlations between ORF scores and reading comprehension are broadly consistent with previous EFL studies reporting associations between prosodic reading performance and reading comprehension (Hannah et al., 2025; Hwang, 2025).
Significant differences across ORF proficiency levels were observed for most speech measures, including WPM, WCPM, SCPM, SCPS, and accuracy, whereas F0 range did not show consistent level differences. This finding is consistent with previous studies reporting that higher L2 proficiency is associated with higher values of temporal fluency measures (Hieke, 1985; Kim, 2022; Lennon, 1990). In contrast to previous studies highlighting F0 range as an important predictor of fluency (Kallio, 2024; Kim, 2022), F0 range did not significantly differ across ORF proficiency levels in the present study. This may indicate that F0 range calculated across the entire utterance in the present study was not sufficient to distinguish prosodic differences among middle school EFL learners, reflecting a limitation of relying on F0 range alone to capture the broader prosodic characteristics represented in the teacher ratings.
Predictive modeling further revealed that Model C, which combined speech measures with the RC14 score, significantly outperformed Models A, B, and D, although the absolute differences in predictive performance among the models were small. More specifically, Model B, which added RC4 to the speech-only Model A, did not improve predictive performance, whereas Model C significantly outperformed Model B. This difference may reflect the greater discriminative power of the RC14 measure, as its larger number of items may have provided a more stable estimate of reading comprehension.
At the same time, it should be noted that the generally strong predictive performance observed across the models may partly reflect shared variance between the teacher-rated ORF scores and speech measures that incorporate an accuracy component.
In addition to conventional word-based measures, the present study incorporated syllable-based measures, including SCPM and SCPS, to examine their complementary role in predicting ORF performance.
5. Conclusion
This study proposed and validated predictive models as a foundation for future automated ORF assessment using speech and reading comprehension measures from Korean middle school EFL learners. The results showed that ORF scores were associated with reading comprehension, that all speech measures except F0 range differed across ORF proficiency levels, and that the model combining speech and reading comprehension measures achieved the strongest performance in predicting ORF scores. In particular, SCPM showed the largest absolute standardized coefficient in the predictive model, while high correlations were observed among several speech measures.
A key contribution of this study is the development of a curriculum-based ORF scoring rubric and the construction of a speech dataset. Our study extends the traditional ORF framework by providing empirical support for the inclusion of prosodic and comprehension-related features beyond accuracy and speed. Furthermore, for EFL learners, we argue that segmental accuracy should be included as a component of ORF assessment, given the importance of pronunciation in oral reading performance. Our approach incorporates information particularly relevant to EFL contexts while retaining conventional ORF measures. Overall, the findings provide empirical evidence that may inform the future development of automated ORF assessment using speech and reading comprehension data.
The following limitations should be noted. First, the participants were recruited from a single middle school in Seoul, which may limit the generalizability of the findings. Second, although the RC items underwent expert review, internal consistency reliability could not be estimated retrospectively because only total scores were retained for analysis. Finally, the utterance-level F0 range used in this study represents only one aspect of prosody and may not fully capture individual differences in prosodic fluency.
Future research should explore the implementation of speech and phoneme recognition technologies to automatically extract the measures examined in this study. It should also examine learners across a broader range of proficiency levels and conduct external validation using independent samples from different schools and reading passages varying in difficulty and genre. In addition, a broader set of prosodic measures, including percentile-based F0 range, pause measures, rhythm, and phrase-level intonation, should be investigated to better capture prosodic expressiveness.


